Michigan State University Uses GIS to Rethink and Innovate Litter Management on Campus
Adam Lawver, the campus services director at Michigan State University (MSU), realized that maintenance workers’ valuable time was being wasted servicing trash receptacles on campus that were rarely or never used.
To save the workers time and lower the annual cost of maintaining more than 400 waste bins, the staff decided to eliminate those that were rarely being used.
But where were these often-empty bins located on the sprawling, 2,000-acre campus in East Lansing? Which ones were no longer needed? Could more efficient routes be created for maintenance workers emptying and cleaning the most used trash cans, saving time and labor costs?
For the answers, Lawver’s team sought a technology-based solution that leveraged location-based data. Lawver contacted Jade Freeman, GIS coordinator for the spatial data management team in the MSU IT Analytics and Data Solutions department, who used ArcGIS technology from Esri to allow landscape services staff to collect data on the bins and analyze which bins were underutilized.

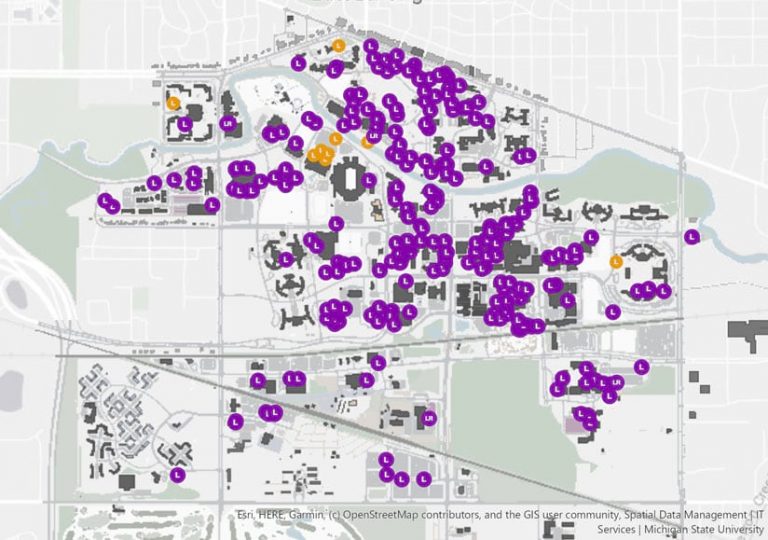
First, a geodatabase was designed to capture information about the types of bins on campus, their locations, and related maintenance and service records. The services were published in ArcGIS Enterprise. Then, a map was created in ArcGIS Online that highlighted bins that needed service based on their service frequency and last service data. Workers used ArcGIS Collector to map each bin location and gather maintenance data each time they serviced one of the 436 bins on campus, providing the information needed to decide—after a 90-day trial period—which receptacles were rarely being used and could be removed.
“We wanted to reduce the number of containers campus-wide based on measuring utilization through GIS technology,” Lawver said.
Lawver and Freeman helmed this innovative project to transform litter management, a process that had stayed relatively the same for decades.
“We were able to quickly design a solution that allowed bins to be mapped to keep track of frequency patterns,” Freeman said. “That really illustrated the power of what GIS could do.”
Both Lawver and Freeman planned and worked together to integrate GIS technology into the litter management system at MSU and streamline the process by doing the following:
- Reducing labor and equipment costs by 50 percent, resulting in a cost savings of $215,000 annually by the fourth year of implementation
- Engaging frontline and office staff to use GIS software including ArcGIS Collector and ArcGIS Dashboards.
- Reallocating hours to perform other core maintenance tasks
- Partnering with MSU’s College of Engineering to further innovate the program
Hurdles to Overcome
MSU began to use GIS technology to completely transform and innovate litter management for its 2,000-acre maintained campus six years ago. However, the initiative faced several challenges including the following:
- No known data or records of the number of receptacles on campus were available.
- No records existed of the most efficient routes to take to service all the receptacles.
- Too much time was being spent servicing rarely used bins, resulting in time away from other core maintenance tasks.
- Employees performed litter management based on intuition and experience for knowing which receptacles needed to be serviced, but passing along this knowledge to new employees was sometimes difficult.
Historically, litter management processes were shared when new employees were onboarded. This transfer of knowledge from employee to employee resulted in a process based mainly on habits and intuition rather than the establishment of a defined route for servicing the bins.
“Employees would drive around to each trash can in the 180 acres they were responsible for,” Lawver said. “None of them were provided with the most efficient route in their area nor was there information to tell them which bins needed service.”
MSU Mobilizes the Workforce
After the location data on the trash bins was collected and mapped, it was published as feature classes so that attributes could be assigned to them. During the mapping process, the landscape services team learned there were 436 bins on the MSU property.
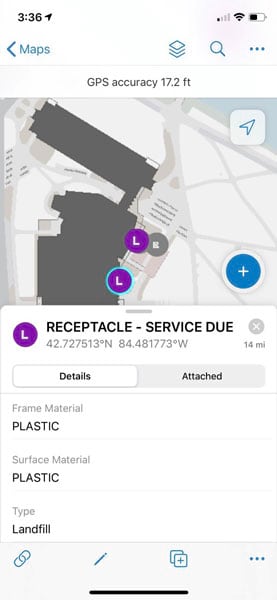
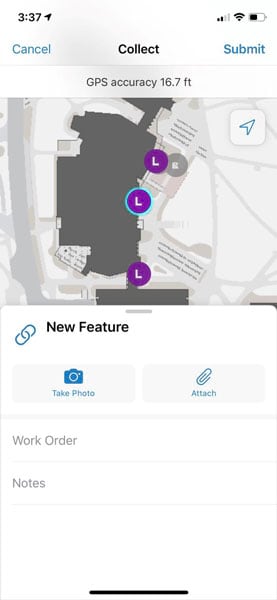
Employees then used ArcGIS Collector on their employer-issued Apple iPads or iPhones to update the status and appropriate service interval of the receptacles. Each time a bin was emptied it was entered as a related record in ArcGIS Collector, and the service interval was adjusted as needed by selecting from a drop-down menu (e.g., weekly, biweekly, or monthly).
Employees also used the app to note whether the receptacle needed repairs or if the container should be moved to another area on campus.
Uncovering Patterns with GIS
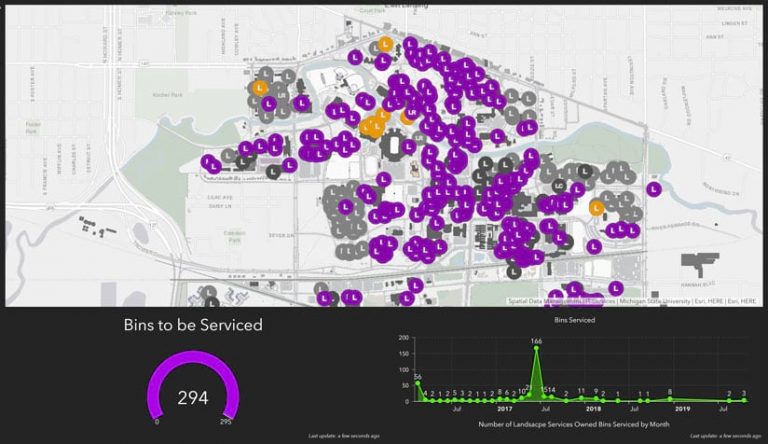
The 436 bins were set up on a weekly service rotation. After performing their maintenance tasks, the employees recorded the data about the task in ArcGIS Collector. After collecting data for six months, ArcGIS Dashboards was deployed to visualize the information.
By using the dashboard to study the patterns of what type of maintenance was being done on each of the bins and how often, the leadership team found that 200 bins only needed servicing every two months. Eventually those trash receptacles were eliminated completely.
Implementing ArcGIS Dashboards also gave the employees a way to see the progress they were making toward monthly and yearly goals. This built trust among teams, increased morale, fostered mutual respect between the workers and supervisors, and inspired pride and accountability.
Cutting Litter Management Costs in Half
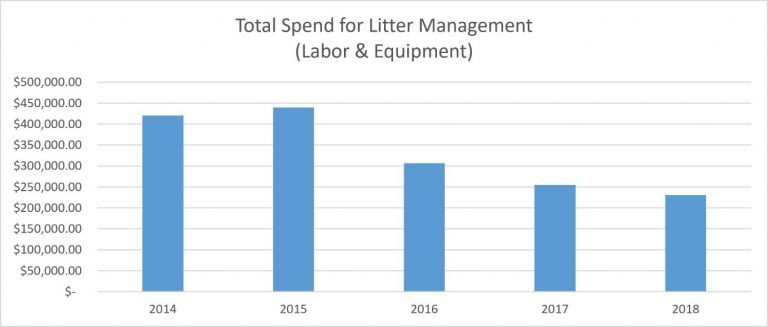
The most significant result of the project was the drop in litter management costs.
Labor and equipment costs in 2015 were $445,000, and in 2018 that dropped to $230,000, meaning there was a 50 percent decrease in labor and equipment costs performing the task of litter management.
The hours spent servicing the trash bins can now be allocated toward performing more productive maintenance tasks, giving the employees the opportunity to increase their skill sets.
MSU has become highly efficient at using ArcGIS to better manage litter. The number of employees working on litter management dropped from 40 employees to one full-time worker and a student assistant.
Bin Capacity Sensor Student Capstone Project
Other opportunities remain to further refine the litter management routes and inform employees when to service bins.

In 2018, the College of Engineering Design Day program started collaborating with Kris Jolley from MSU’s Surplus Store and Recycling Center to have MSU students design and build a capacity sensor for receptacles as a capstone project.
“Bin capacity sensor technology informs staff when to service receptacles, eliminating wasteful trips [and] reducing trash overflow,” Lawver said.
A sensor prototype was built by the student team. As testing on the prototype began, the team members identified alternative commercially available capacity sensors. These sensors have the potential to integrate with the GIS software and alert employees on their mobile devices when a receptable is at 75 percent capacity and requires service.

What’s Next: Automating Litter Management through GIS and Network Patterns
Lawver and his team will continue to build on the idea of sensor technology integration with bins using GIS throughout the campus. In the fall of 2019, bin servicing shifted to the Surplus and Recycling department, resulting in further savings in labor and equipment costs. Now, the potential exists to leverage GIS for even more innovative initiatives like deploying mobile robotics for automating litter management.
In the future, GIS may be used to create a network of patterns of when receptacles need to be serviced. That pattern of code can trigger mobile robots to navigate to the bins requiring service and empty them, returning the debris to a larger bin. The larger bin would then be serviced by a trash truck.
“One way or another, new technologies will shape how and what we do,” Lawver said. “The critical question is how we, as leaders, build trust to foster a workplace that inspires high-performance and flexibility in response to emerging technologies.”