Drones. Imagery. Video. Sensors. Real-time data. Focused mobile 3D applications. Big data. The cloud. The Internet of Things (IoT).
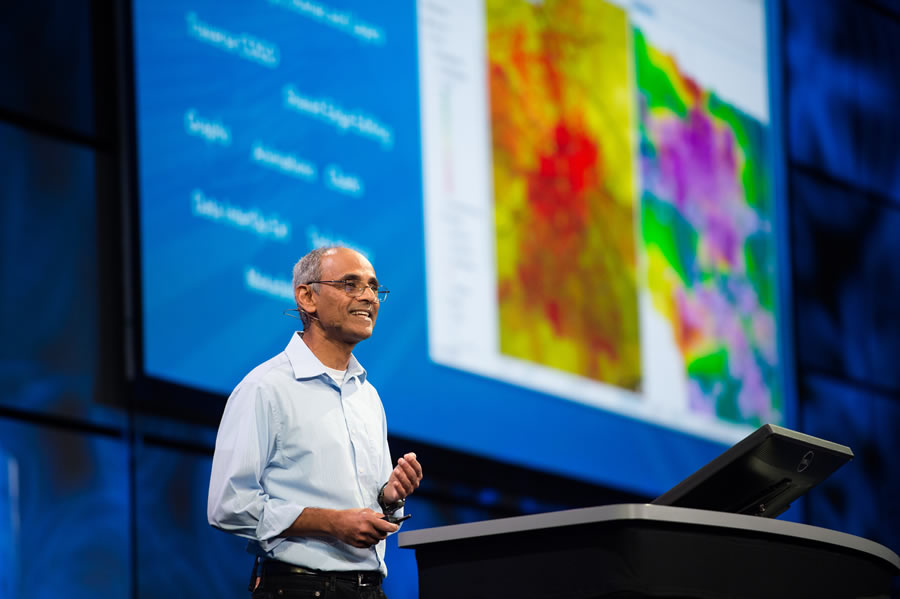
All are examples of the types of technology, information, and applications that are increasingly impacting how geospatial data is collected, analyzed, visualized, and shared. “These are a new reality,” said Sud Menon, Esri director of software development, during the opening of the eleventh annual Esri Developer Summit(DevSummit). “Our world is changing, and ArcGIS is changing to embrace all of these.”

How ArcGIS is evolving in this rapidly changing data and technology landscape was reflected at the DevSummit, which drew more than 1,700 people to Palm Springs, California, during the second week of March 2016. Mixed in with the technical sessions on app development were talks focused on real-time GIS, analytics, web 3D GIS, live data deployment, the IoT, wearables, and drones.
Marius Rocher, a software engineer for TC Technology in Carlsbad, California, was excited to hear everything. He said he attends the DevSummit annually to keep up with what Esri has been developing. “They are the trendsetters,” Rocher said, adding that his company, which mainly works with utilities, leverages ArcGIS in its solutions.
During Menon’s overview of the ArcGIS platform, he emphasized that it’s a system that developers can build upon, highlighting several Esri initiatives that will drive the new age of intelligent mapping:
- Future updates to ArcGIS Online, Esri’s cloud-based GIS, will give users the ability to host vector tiles, create configurable 3D applications, and do advanced analytics.
- There are new field, office, and public apps that work together. For example, Esri’s suite of field apps—such as Collector for ArcGIS, Workforce for ArcGIS, and Survey123 for ArcGIS—can provide actual or near real-time information that can be monitored using Operations Dashboard for ArcGIS. Another app, now in beta, that’s generating a lot of buzz is Drone2Map for ArcGIS, which turns still imagery from drones into 2D and 3D imagery products for visualization and analysis in ArcGIS.
- 3D mapping across the platform is powered by an information model using web scenes and 3D layers.
- Substantial enhancements to the real-time infrastructure in the new ArcGIS 10.4 include increased data ingestion and storage rates.

“We’ve added a new spatiotemporal data store to the system,” Menon said. “That supports archiving observations that come in at high velocity and supports high-performance visualization both for information in real time and historically.” Learn more about spatiotemporal big data stores.
In the months ahead, Esri will focus on bringing together big data, standard data, business data, and GIS data to help organizations leverage information, observations, and assets to create enhanced systems of insight. “We are doing this in both the user experience and functionality,” Menon said. “In the latter, we are looking at working with big data and harvesting the power of distributed computing. We refer to that initiative as geoanalytics.”
And to help users analyze data more easily, Esri is developing Insights for ArcGIS, set for release later this year.

Getting Insight from Your Data
Data alone does not provide meaning, but a thorough analysis of data does. “We all know data is important, but it’s not as important as the answers it provides and the stories that it tells,” said Art Haddad, chief technology officer of location analytics for Esri.
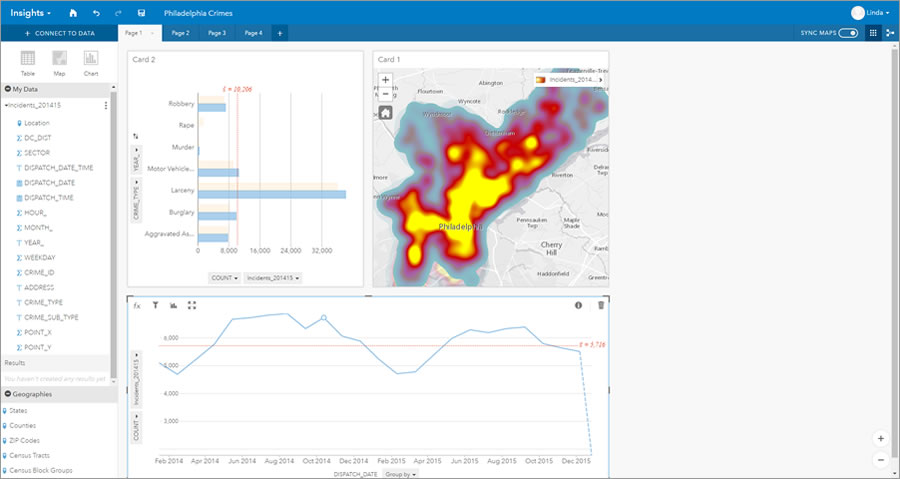
Insights for ArcGIS will provide an interactive way of analyzing data and exploring the results within a user-friendly environment by using maps, charts, and tables, Haddad said. People will drag data—including their enterprise data—onto digital cards that display the information as maps, charts, and tables (or all three). Then they can analyze their data right on the cards.
Esri’s Linda Beale demonstrated workflows for Insights for ArcGIS, using the crime statistics of a major American city as an example. As she used her computer’s cursor to touch various data points on a time line charting the number of residential burglaries over a two-year period, a map next to the chart displayed the burglary locations as points. She then switched to a heat map of the burglary locations. “Now we can explore those [crime] patterns changing over time across the city,” she said. She created more cards as maps, charts, and tables while she continued her analysis.
“Analysis is very much a part of Insights,” Beale said. “The data for format determines the kind of on-the-fly analysis that can be done, either through drag and drop or using the [command] button.”

Kacey Johnson Pham, GIS manager for International Medical Corps, headquartered in Los Angeles, said that Beale later gave her a one-on-one demo of Insights for ArcGIS.
“I was really impressed with the advances in charts and graphs that Esri has made,” said Johnson Pham. “The interactive charts and maps in Insights are fast, visually appealing, and easy to use.”
Developing with ArcGIS
Among the many presentations aimed at app developers was a preview of next-generation ArcGIS Runtime SDKs (a release called “Quartz”) for developing native apps. The Quartz release will be out in June 2016 for iOS and Android.
“With Quartz, we are releasing a significant set of functionality for you as developers,” said Euan Cameron, chief technology officer for the ArcGIS Runtime team at Esri. This functionality includes the following:
- New, improved APIs to build better apps including those for creating maps
- Support for content coming from the cloud or locally stored on devices
- Support for analysis being performed locally on devices or through geoprocessing services
- Support for 3D visualization and analysis on devices supported by Runtime
- Methods to make it easier to build cross-platform native applications

Read more about ArcGIS Runtime SDKs.
Cameron also previewed the release of ArcGIS API 4.0 for JavaScript, which will offer support for creating apps that give users 2D and 3D mapping visualization capabilities and run on any device. The API is scheduled for release in May 2016.
“It’s the JavaScript API reimagined,” Cameron said, adding that Esri developers have created a simpler, more consistent API design. “If you are a 2D map developer or 3D scene developer, we are making it easier for you to integrate it with other JavaScript frameworks as well,” he said.
ArcGIS API 4.0 for JavaScript also will be mobile first. “What does that mean? It means the design of the widgets work great on mobile devices, as well as the traditional desktop browsers,” Cameron said.
David Cardella, Esri product manager for developer technologies, also gave the audience an overview of the updated ArcGIS for Developers website, calling it “the one place that you will go regardless of how you are developing with the platform.”

The site contains information on building apps using JavaScript API, Runtime SDKs, and configurable apps and app builders; extending the ArcGIS platform; and accessing content and services including basemaps, traffic maps, open data, the geocoding service, and the Living Atlas of the World.
Sponging Up Knowledge
DevSummit attendees spent four days soaking up information and inspiration.
They got advice on programming who was from keynote speaker Douglas Crockford, a computer programmer who was instrumental in developing the JavaScript programming language. He also wrote JavaScript: The Good Parts.
Crockford told the app developers to take to heart a line from a book written by French aviator and The Little Prince author Antoine de Saint-Exupéry: “It seems that perfection is attained not when there is nothing more to add, but when there is nothing more to remove,” Saint-Exupéry wrote in Wind, Sand, and Stars, one of his aviation-oriented books.

“Just a brilliant sentence,” said Crockford. “He was talking about the design of airplanes, but it applies to everything. It applies especially to software. We have requirements in software [for which] programs need to be perfect. Because if a program is not perfect, then the computer has license to do the worst possible thing at the worst possible time.”
Crockford also said that programming languages should be edited to the essentials, or “good parts.” “If a feature in a programming language is sometimes useful and sometimes dangerous and if there is a better option, then always use the better option,” he said. “We are not paid to use every feature of the language. We are paid to write programs that work well and are free of error.”
To watch all the Esri DevSummit Plenary Session presentations and hear the entire Keynote Address by Douglas Crockford, visit the Esri Developer Summit website.

