What You Will Need
- ArcGIS 10.3 for Desktop (any license level)
- An ArcGIS Online account (one comes with your ArcGIS for Desktop)
- Sample dataset [ZIP] [3.47 MB]
Agencies and residents in areas at risk from wildland fires often develop a Community Wildfire Protection Plan (CWPP) to understand and mitigate wildland hazards and risk. This exercise shows how a map created in ArcMap that contains data used to develop a CWPP can be shared with the public and other agencies by generating a web map. This web map could also be used to gather input and gain support for various programs.
Concerned individuals collaborate with protection agencies, including firefighters, local and state government, and federal land management agencies, to produce a CWPP that identifies and measures the level of wildfire threat. Two important CWPP steps include conducting a community risk assessment and establishing community hazard reduction priorities. These steps are greatly enhanced and simplified using GIS for field data collection, analysis, and communication with shareholders. Developing a CWPP has never been easier with new tools and capabilities built into ArcGIS for Desktop and ArcGIS Online.
About This Exercise
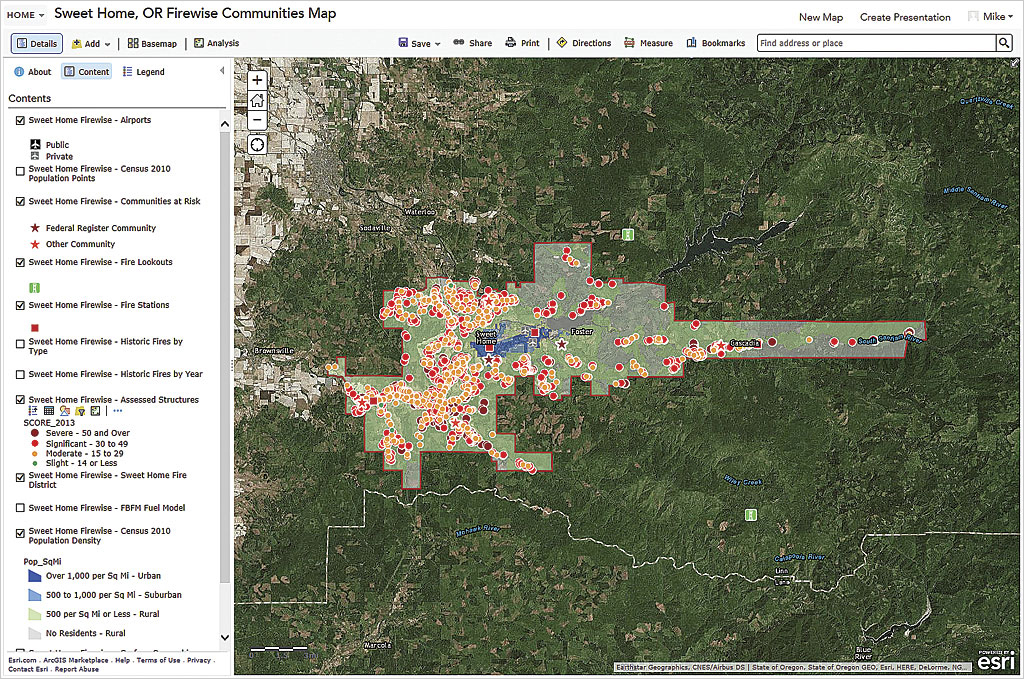
In this exercise, you will review and share a map showing community risk, hazard, and values for the Sweet Home Fire & Ambulance District, located in Linn County, Oregon, approximately 80 miles south of Portland. Linn County stretches from the Willamette River valley eastward to the Cascade Crest, including the Interstate 5 corridor. Most Wildland/Urban Interface (WUI) communities are located east of Interstate 5 and include the towns of Lebanon and Sweet Home.
From 2006 to 2008, Linn County, together with the Oregon Department of Forestry, the US Bureau of Land Management, the US Forest Service, and others, prepared a comprehensive Community Wildfire Protection Plan. Field data collection, community input, and WUI analyses were compiled and reported by ECONorthwest of Portland, Oregon, an economics, planning, and financial consulting services firm. Mapping was performed by my consulting GIS and geology mapping consulting firm, Entrada/San Juan, Inc., of Blaine, Washington.
The data for this exercise includes areas within the Sweet Home Fire & Ambulance District. The district’s total area exceeds 145 square miles and includes the community of Sweet Home and extensive eastern forestlands. Through the Sweet Home Rural Fire Board, the agency provides protection to approximately 6,000 people and 2,500 structures in the district’s 55-square-mile rural area. The data is synthesized to support valid field observations without compromising personal resident information.
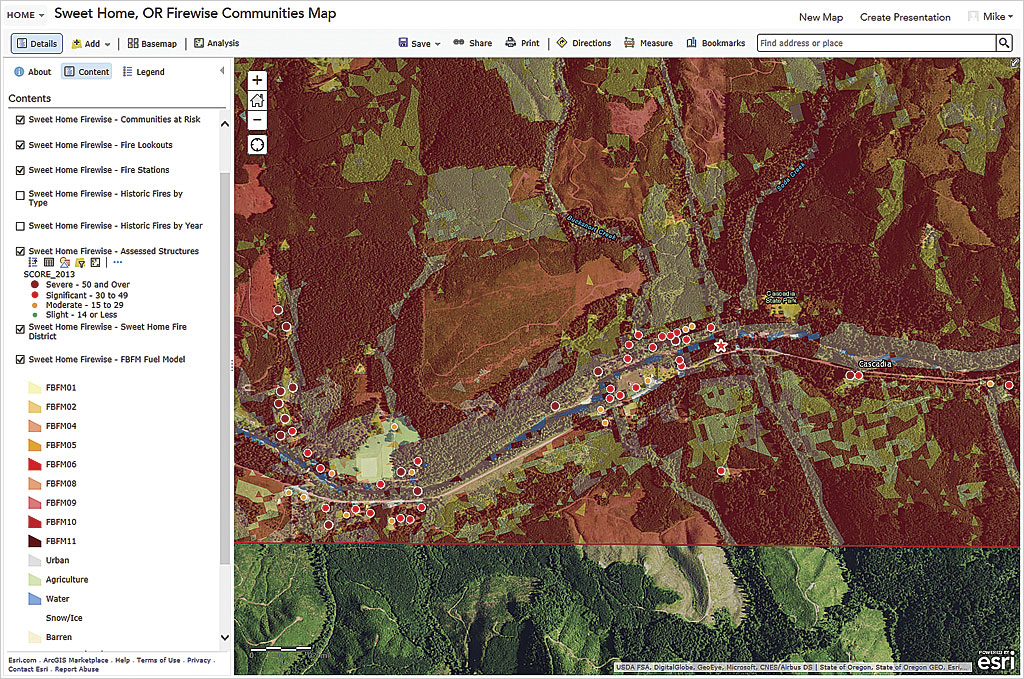
This exercise opens with a finalized map of the Sweet Home District. After reviewing this map, you will make some changes to the map so that it can be published as a feature service on ArcGIS Online. After publishing the feature service, you will log on to ArcGIS Online, create a new map, and add the feature service. You will look at the data layers that are used in the analysis of risk, hazard, and value in an interactive map that can be shared internally and (if appropriate) externally.
You will need an ArcGIS Online account to do this exercise. If you already have an organizational account, this exercise will consume a few credits. Even if it is not active, you will likely already have an ArcGIS Online subscription. You get an ArcGIS Online subscription with every ArcGIS for Desktop license that is current on maintenance. However, even if you do not have an ArcGIS Online subscription or ArcGIS for Desktop license, you can still do this exercise by signing up for a free 60-day trial for ArcGIS Online that provides access for five named users, all the ready-to-use apps, the Living Atlas of the World, and a 60-day trial of ArcGIS for Desktop.
Getting Started
To begin, download the Sweet Home sample data [ZIP]. Save and unzip it on a local drive. In the Sweet_Home folder, open Sweet_Home01.mxd. To study the entire district, open Bookmarks and choose Sweet Home 1:200,000. Inspect the data layers and develop an understanding of the risk, hazard, value, and protection (RHVP) factors for this area. Layers that aid in the analysis of RHVP in the map include
- Airports
- Census 2010 Population Points
- Communities at Risk
- Fire Lookouts
- Fire Stations
- Historic Fires by Type
- Historic Fires by Year
- Assessed Structures
- Sweet Home Fire District
- FBFM Fuel Model
- Census 2010 Population Density
- Surface Ownership
Preparing the Map for Publishing
ArcGIS Online depends on robust metadata to support data loading, storage, and sharing. While the Sweet Home data includes complete metadata, the ArcMap document contains limited metadata.
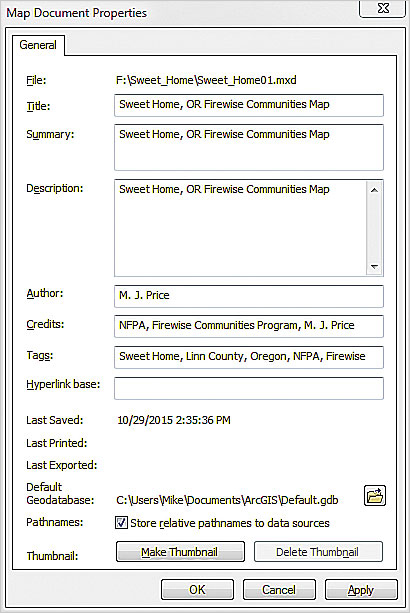
The first step is to choose File > Map Document Properties to open the Map Document Properties window and provide initial metadata. Verify that the path to the file is correct.
Type Sweet Home, OR Firewise Communities Map for the title and copy this title into the Summary and Description boxes.
Enter your name in the Author field. In the Credit field, type NFPA, Firewise Communities, and M. J. Price. (This data was obtained from multiple agencies; I simplified and synthesized it for this exercise.)
For Tags, enter Sweet Home, Linn County, Oregon, NFPA, Firewise. Be sure to separate each tag with a comma.
Set the default Geodatabase to \Sweet_Home\GDBFiles\UTM83Z10\Sweet_Home.gdb. Check the box to use relative pathnames and create a thumbnail. Click Apply and save the project.
Signing in to ArcGIS Online, Ungrouping and Simplifying Symbology
In the Standard toolbar in ArcMap, choose File > Sign In. In the ArcGIS Sign In window, enter your user name and password and click SIGN IN.
After signing into ArcGIS Online, return to ArcGIS for Desktop to update several items in the table of contents (TOC) for Sweet_Home01.mxd. These changes will facilitate data publishing.
In the TOC, right-click the Historic Fires Group and choose Ungroup. ArcGIS Online does not allow grouped data, so these must be separate layers.
Next, right-click Historic Fires by Year, choose Properies, and click the Symbology tab. Click the Advanced button and open Symbol Levels. ArcGIS Online does not use symbol levels, but it will handle this issue when the feature service is created. Save the project.
Publishing Our Sweet Home Feature Service
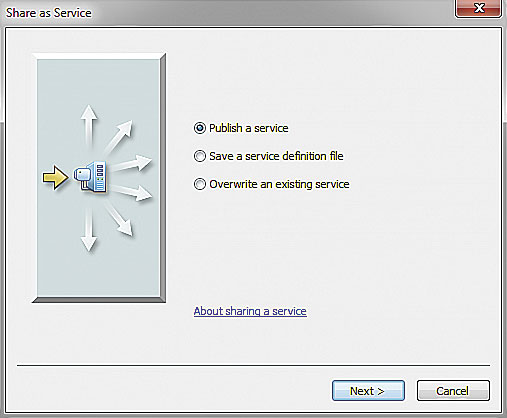
Once again in the Standard toolbar in ArcMap, choose File > Share As > Service. In the Share as Service wizard, click the Publish a Service radio button and click Next. In the next pane, select your organization’s hosted service and name the service Sweet_Home_Firewise. Click Continue.
Open the Capabilities selection and check the Feature Service checkbox to enable users to view and manage individual layers.
Uncheck the Tiled Mapping checkbox. Since the Sweet Home extent is a rather small dataset that does not include images or other raster objects, tiling is not necessary. In addition, Map Tiles consume considerable credits. We want to publish data as efficiently and inexpensively as possible.
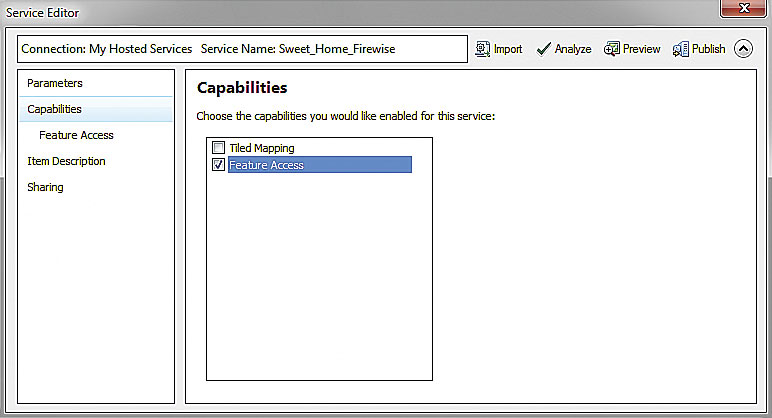
In the Service Editor, select the Item Description and complete all items. The Summary and Description fields should read Sweet Home, OR Firewise Communities Map. To facilitate searching for individual layers, add the following tags to your list and separate them with commas: Fire Station, Fire District, Fire Lookout, Communities at Risk, Airport, Population, Historic Fire, Assessed Structure, Fuel Model, and Surface Ownership. I try to keep most of my tags in the singular form and avoid redundancy whenever possible. I do not include many abbreviations and only a few acronyms.
Return to Feature Access and select Operations allowed. For now, check only Query. Later, you may authorize other operations for selected users in your organization and in other groups.
Finally, choose Sharing and decide if you will share your service with only yourself (My Content), your organization, or Everyone. In this example, I share with everyone in my organization.
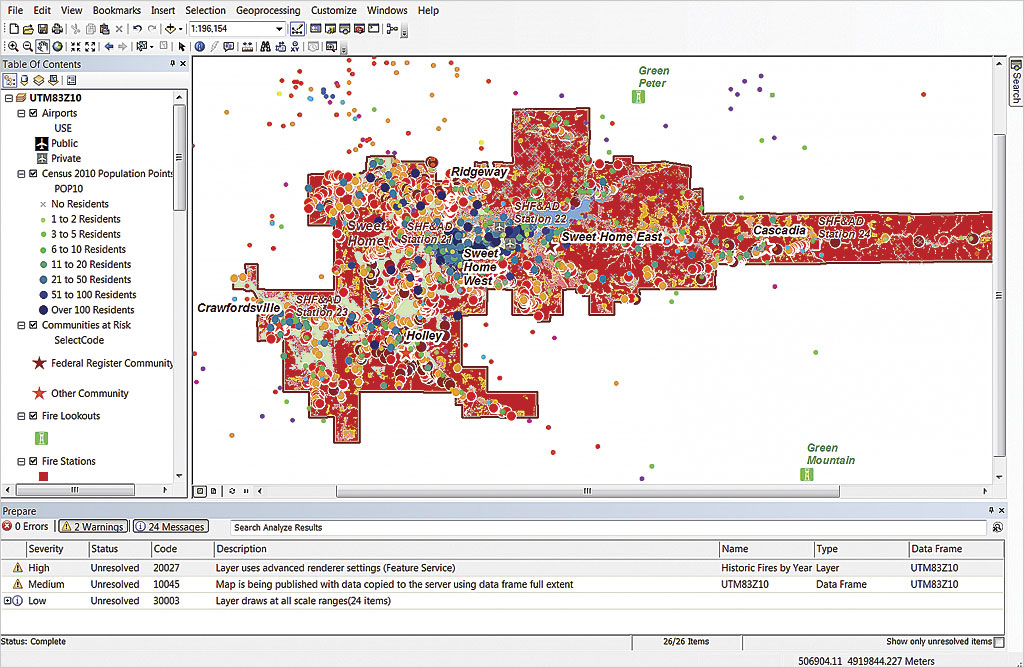
In the upper right line in Service Editor, click Analyze and wait while ArcGIS analyzes the map.
Reviewing Messages before Publishing the Map
ArcMap will generate High, Medium, and Low warning messages. The High and Medium warnings are indicated by yellow triangles with an exclamation point. It should not generate any Fatal Errors, denoted by a red circle containing a white X. The items flagged by this analysis will be handled during the publishing process, so you will not need to do anything.
Finally, click Publish. ArcGIS will prepare and publish the data. You should receive a message indicating that your data has been published successfully. The extra time and effort taken to clean, standardize, and document the ArcMap document prior to publishing helps avoid any fatal errors. After publishing, save your project and prepare to view the Sweet Home map on ArcGIS Online.
Opening the Map in ArcGIS Online
You can use ArcGIS Online to view and analyze the Sweet Home data.
Start your Web browser and log in at arcgis.com/home/login.html if you are not already logged in. Enter your user name and password, just as you did in ArcMap. Verify that you are on your organization’s home page and that you are an authorized user.
Open My Content and verify that a Sweet_Home_Firewise Feature Layer and Service Definition have been created and uploaded.
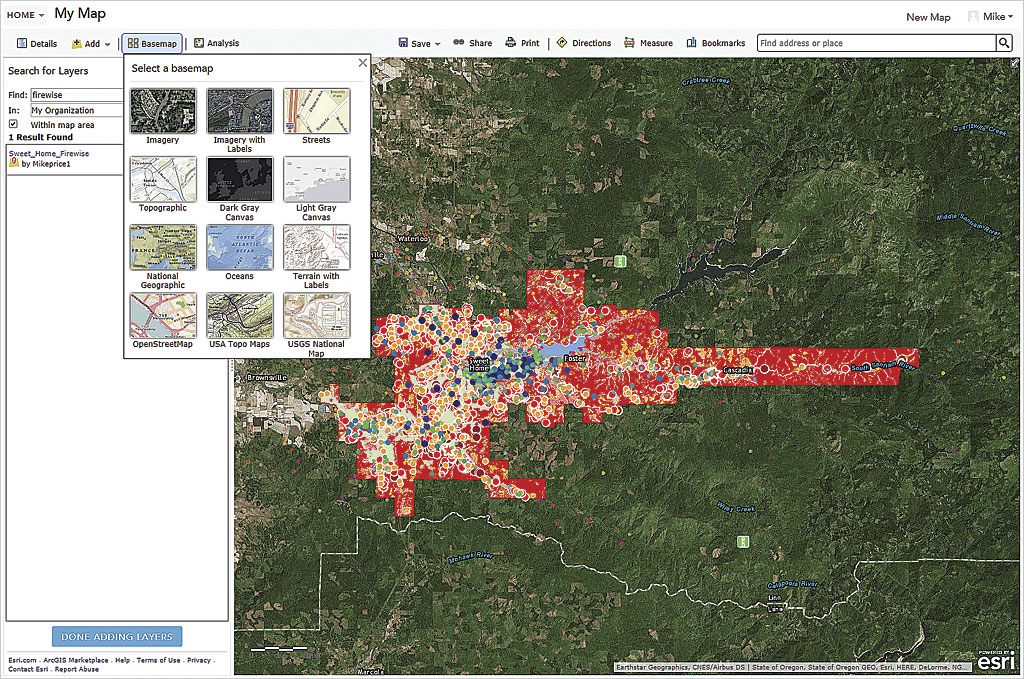
Return to the top line menu. Click New Map from the top line menu. By default, the Topographic basemap will be applied. Click the Basemap button and open the Basemap Gallery. Browse through the gallery and select an interesting basemap. (You can always change it later.)
Click the Add button and select Search for Layers. Type firewise in the Find window and search In My organization. Click Go. The Sweet_Home_Firewise Feature Layer should appear. Select it and click Add.
When your published service loads, ArcGIS Online will zoom to the extent of the Sweet Home District. Once the service has loaded, preview the data, noting that all layers appear to be turned on and that polygon layers are not transparent. When finished, click the DONE ADDING LAYERS button.
ArcGIS Online displays the TOC on the left side of the workspace. All layers will be checked and visible. They are arranged in the same order as they were in the ArcMap document used to create the service and retain the same symbology.
Since all layers appear to be correctly published, save the ArcGIS Online map. In the top line menu, click Save, then Save again. Name the map Sweet Home, OR Firewise Communities Map. Add appropriate tags so you and others can find the map. (Tip: I keep a tag library in a separate document, so I can quickly and consistently locate and assign them.) Complete the summary and save the map in your home folder and click SAVE MAP to finish.
Examining the Map
Hold down the Ctrl key and click the checked box for any visible layer to turn all layers off. Check the Surface Ownership, Sweet Home Fire District, and Fire Stations layers to display them. In the TOC, make sure Content is selected. With Content selected, hover the cursor over each layer name to show the tool icons associated with each layer.
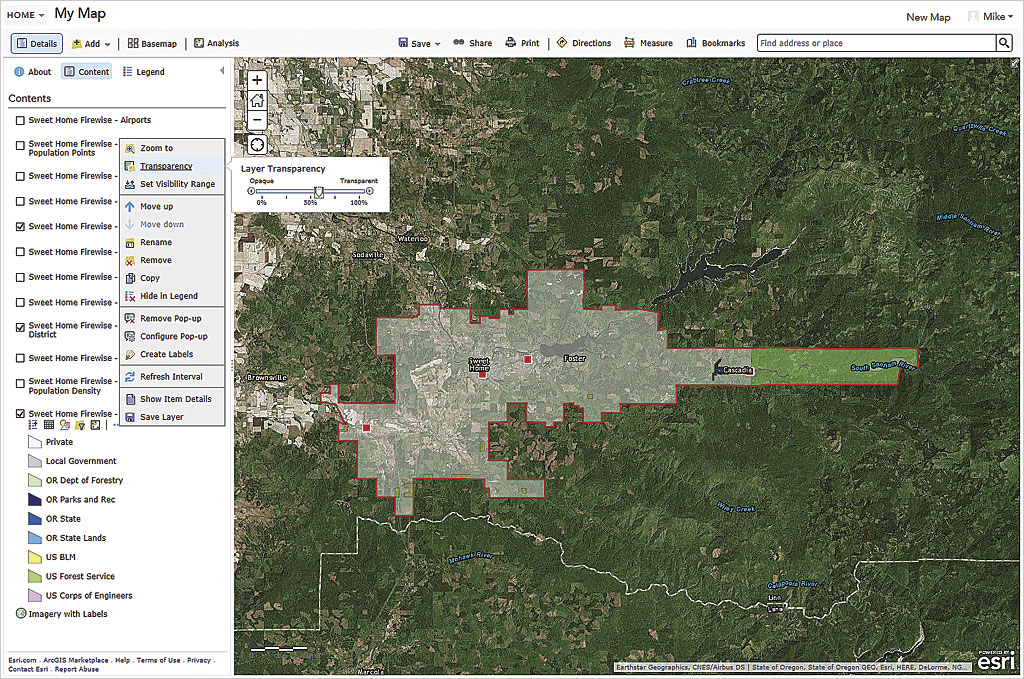
In the TOC, hover the cursor over Surface Ownership and select the ellipsis (three dots) to the right of the tool icons to open More Options. Open the Transparency tool and set the Layer Transparency slider to approximately 60 percent. Click inside the map area to apply it. Turn off Surface Ownership.
Turn on the Census 2010 Population Density layer, display its legend, and set its density to approximately 50 percent.
Locate the table icon under the Census 2010 Population Density layer (it is the second icon from the left) and click it. This table should look just like the attribute table in the source ArcMap document. Momentarily switch back to ArcMap and check the attribute table, noting the feature count. Minimize ArcMap and return to ArcGIS Online.
Hover your cursor over the Pop_SqMi field name in the table. A small gear icon appears. Click this icon and select Sort Descending. Starting at the top of the column, select all census blocks with a population per square mile greater than 10,000. At least eight small polygons will be outlined in cyan. These are the densest population areas inside the Sweet Home District.
Using Filters and Bookmarks
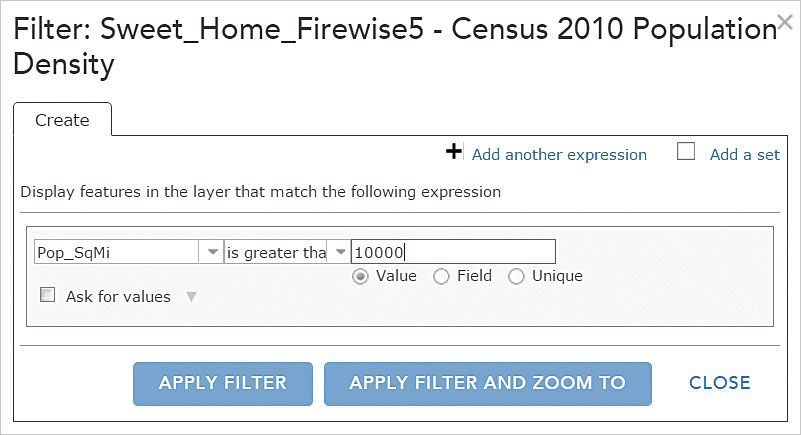
It is acceptable to select records manually. This encourages you to look closely at the data. However, instead of using manual selection, apply a filter that will show only certain records. In the TOC, locate the Filter button (small funnel on a yellow background) for the Census 2010 Population Density layer. Use the expression builder to create a Filter to show features with Pop_SqMi greater than 10,000. Click APPLY FILTER AND ZOOM TO.
You can see that nearly all densely populated census blocks are inside the community of Sweet Home. Try filtering all blocks with a population of less that 500 per square mile. According to the National Fire Protection Association (NFPA) definition, these are truly rural blocks. Choose Table > Clear Selection to deselect records. Click the Filter icon again and click REMOVE FILTER to remove the filter before creating a new one on another layer. Experiment with other filters on different datasets.
Next, set several bookmarks. Select More Options for Sweet Home Fire District and click Zoom To. In the top line menu, click Bookmarks, then Add. Name the bookmark Sweet Home Fire District. Turn on Communities at Risk and click on Cascadia, located in the eastern district. Zoom to this point and create a second Bookmark named Cascadia.
Continue Exploring
You are now on your own, free to experiment with other layers, transparency settings, and filters. Imagine ways that this data could be displayed to members of the community to obtain resident input and support for various programs. However, remember that this project really has its roots in a rather unsophisticated ArcMap document.
Acknowledgments
This exercise was created from data collected and analyzed for a real Community Wildfire Protection Program document. Although it has been synthesized to retain some anonymity, it remains quite true to reality. Thanks to the many providers and program participants, including Linn County and its fine GIS department, the Oregon Department of Forestry, the US Forest Service, the US Bureau of Land Management, the National Fire Protection Association and its Firewise Communities program, and my associates at ECONorthwest for all their help and support.

