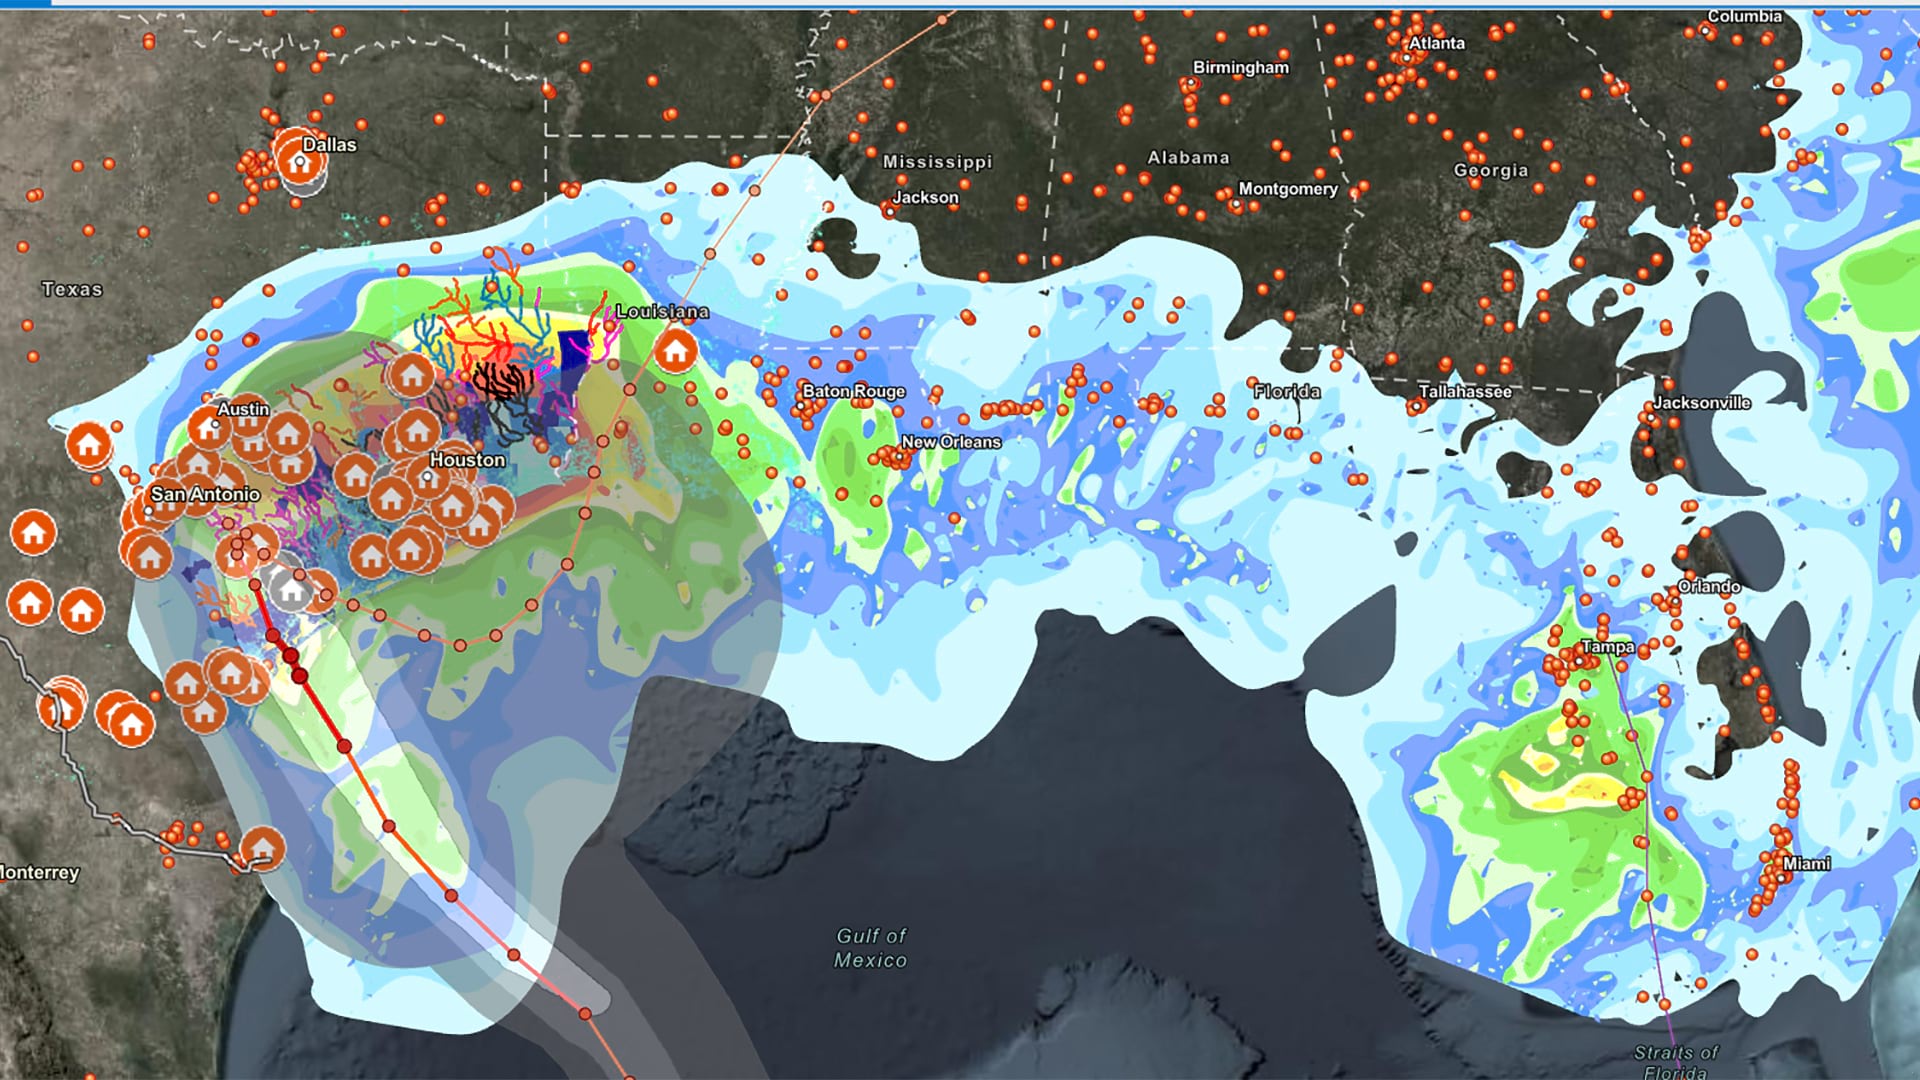
Have you ever opened someone’s web layer and watched as it struggled to draw or needed a few seconds to generate that pop-up? In contrast, layers like American Community Survey data from the US Census Bureau or hurricane forecast data appears as fast as lightning.
While it can take some real skill to quickly display large, complex datasets, improving performance for simpler layers can be boiled down to five tips described in this article. They take only a few minutes to implement and will greatly improve the performance of your web layers.
1. Strip It Down
Do you need all those fields? Does the data really need six decimal places? Make the data neat and compact. When possible, use integer instead of floating point for number formats. Round floating points to some reasonable precision. Reduce the maximum number of characters in a string length. If you imported data from Microsoft Excel, the fields default to 32,767 characters. This will choke your service. Also, remember that some fields can also be calculated on the fly with ArcGIS Arcade if the data is only needed for pop-ups or symbology. This technique makes the table smaller and easier to load.
2. Add Attribute Indexes
Every time a pop-up is generated, the client queries the server. The same thing happens when symbology is drawn or changed, or a dashboard graphs data. Adding attribute indexes to any field a user might query, filter, or use in a pop-up or for symbology will greatly diminish performance. In layer settings, go to manage indexes and configure field indexes. You can also use the Add Attribute Index tool in ArcGIS Pro.
3. Run Optimize Layer Drawing
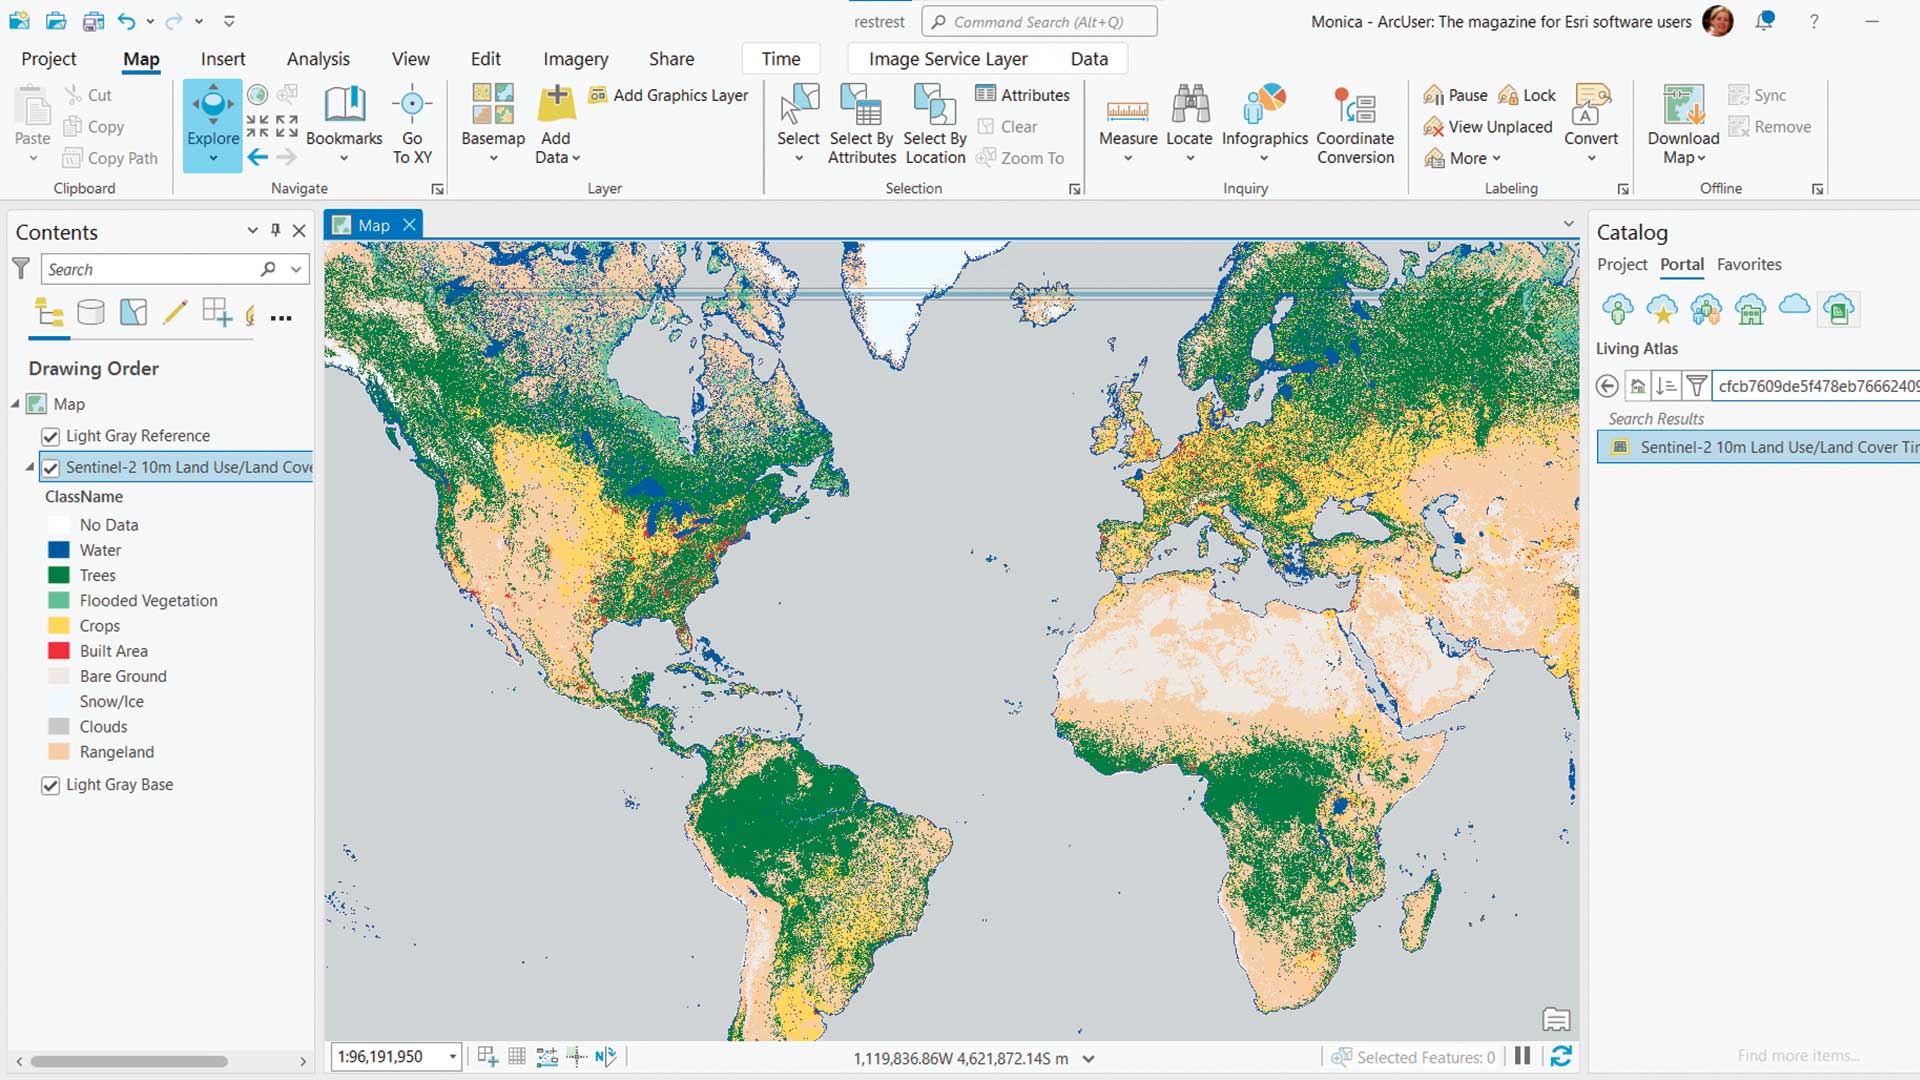
You have a layer in ArcGIS Online that was either published from ArcGIS Pro or uploaded from a geodatabase. (Note: Do not publish from ArcMap.) Now what? After fully configuring its content item, head to the Settings tab. In the Feature Layer section, click the Optimize Layer Drawing option and let that run for a few minutes.
4. Check Cache Control
After Optimize runs, scroll down to Cache Control at the end of the Settings page for the item. [Publicly shared data is cached by the Content Delivery Network (CDN) to decrease latency in content delivery.] You’ll see the cache is set by default to 30 seconds. If your data is updating quickly, keep that setting. Typically, data updates aren’t run every few minutes. For most layers, crank that interval up to one hour. That means that any view, zoom level, or query that someone makes will be held in memory for one hour.
5. Be Careful with Custom Symbols
ArcGIS Online has some great symbol options, but sometimes you need to personalize the layer a bit more. If you go down this road, tread carefully. Here’s a few best practices when using custom symbols:
- Don’t use lots of different custom symbols that will require many queries to draw the layer.
- ArcGIS Online accepts SVG formats, which is your best choice. Otherwise, use raster images that are no larger than 120 × 120 pixels.
- Export raster images as 8-bit PNGs with transparency. Even better, if symbols have only two colors, export as 4-bit PNGs. Adobe Photoshop has an 8-bit export format available. Choose File > Export > Save for Web (Legacy). It works well if you’re not familiar with programs such as ImageMagik.
- Apply the image on the Visualization tab of your layer or view of the item instead of the service itself. This trick prevents the image from being converted to a text-encoded image in the service.
- Make sure your image is simple and legible at different scales.
Read “Shopping for the Map’s Meaning” (links.esri.com/shoppingmap) for more tips on styling point symbols.
Go forth and update your layers with these tips to make everyone’s maps and apps work better.
About the author