ArcGIS Living Atlas of the World basemaps are the foundation for almost every map or app in ArcGIS, whether used in a browser or on a device. Its layers—such as live feeds, environmental layers, and demographic information—complement and add context to your operational layers.
The foremost collection of curated geographic content, ArcGIS Living Atlas includes ready-to-use basemaps, maps, layers, apps, and tools from Esri and the global GIS user community. It is integral to the ArcGIS system, so whether you are using ArcGIS Online, ArcGIS Enterprise, ArcGIS Pro, or other ArcGIS apps, ArcGIS Living Atlas is an inherent part of your mapping activities.
The valuable resources available from the ArcGIS Living Atlas website can be leveraged in many ways. Here are 10 suggestions for getting the most out of ArcGIS Living Atlas in your work and workflows.
- Begin map authoring at the ArcGIS Living Atlas website.
- Use My Favorites to bookmark ArcGIS Living Atlas content.
- Extend your basemap gallery.
- Use a custom ArcGIS Living Atlas basemap.
- Use ArcGIS Living Atlas apps.
- Use ArcGIS Living Atlas to learn techniques.
- Use (and share) advanced search capabilities.
- Make your maps come alive using live feeds.
- Use ArcGIS Living Atlas content for visualization and analysis.
- Contribute to ArcGIS Living Atlas.
1. Begin map authoring at the ArcGIS Living Atlas website.
If you sign in to your account at the ArcGIS Living Atlas website (livingatlas.arcgis.com/en/home/), you can open the Browse tab to search for layers to begin authoring your maps and scenes. The Browse tab provides comprehensive search and filtering tools to help find maps, scenes, or layers to begin your work. Look for Sign In located in the upper right of the page.
Click options (…) on the item card to open the layer in Map Viewer, Scene Viewer, or ArcGIS Pro, or click the thumbnail or title to view the item pages and open it from there. Because you are signed in, you can continue authoring the map and save it to My Content when finished.
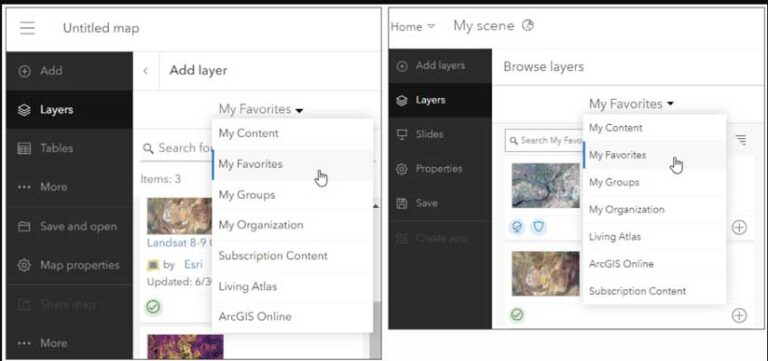
2. Use My Favorites to bookmark ArcGIS Living Atlas content.
Use My Favorites to streamline your authoring workflows across the ArcGIS system. Go to ArcGIS Living Atlas Browse tab and sign in. Use search, then favorite what you find for quick access. My Favorites are built-in to the Map Viewer and Scene Viewer authoring workflow, making this a handy technique to find ArcGIS Living Atlas layers without needing to go back and search again. My Favorites are also built-in to ArcGIS Pro and ArcGIS StoryMaps workflows.
3. Extend your basemap gallery.
ArcGIS Living Atlas has lots of interesting and useful basemaps that aren’t included in the Esri defaults for your organization. Administrators can find more basemaps to add to their organization’s custom basemap gallery at the ArcGIS Living Atlas website. In the Creative Vector Tile Layer and Web Maps group (links.esri.com/creativeVector), you will also find more basemaps from the ArcGIS Living Atlas team you can use.
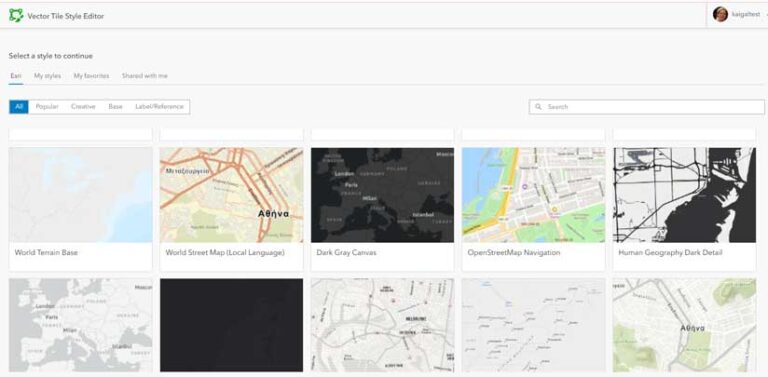
4. Use a custom ArcGIS Living Atlas basemap.
Using ArcGIS Vector Tile Style Editor (links.esri.com/VectorTileEditor), you can customize any ArcGIS Living Atlas basemap for use in your organization or for use in a purposeful map or app. You can change colors, simplify the map, highlight certain aspects, and manage labels and symbols to create a unique style. For more information, see the Vector Tile Style Editor documentation (vtse.arcgis.com/documentation/). The Creative Vector Tile Layers and Web Maps group contains examples and maps that you can start with.
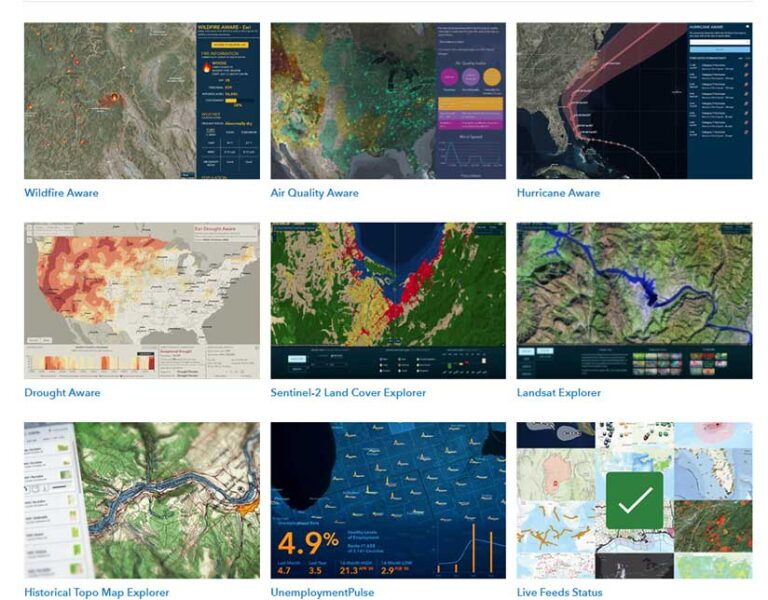
5. Use ArcGIS Living Atlas apps.
Content from ArcGIS Living Atlas of the World is used to make stunning, valuable apps for visualization and analysis. Most of the apps are intended to be used as is to learn more about a topic, such as wildfires, air quality, and drought conditions. Some examples of these apps are:
- World Imagery Wayback
- USGS Topographic Map Explorer
- AirNow
View all highlighted apps by clicking the Apps drop-down at the ArcGIS Living Atlas website.
6. Use ArcGIS Living Atlas to learn techniques.
ArcGIS Living Atlas maps, apps, and layers leverage the very best techniques and tradecraft to turn data into expressive displays of information. These tools include using custom basemaps, applying focus and interest using styles, blending, and effects, and creating eye-catching informational pop-ups.
Open a map or layer, select the layer, then on the Settings (light) toolbar, look at Blending (in Properties), Styles, Effects, and Pop-ups to see how it’s been crafted.
The Esri GitHub repository is available for some of the ArcGIS Living Atlas apps, letting you download the app source code and learn how the app was created or customize it. From the ArcGIS Living Atlas app gallery, click the thumbnail to View app details. Then look for the Download button to take you to the repository.
7. Use (and share) advanced search capabilities.
Using the Browse tab at the ArcGIS Living Atlas website, you can quickly search and filter for specific content. Click Search Examples to see examples of how you can search. Filter by content type (e.g., maps, layers, scenes, apps, tools), date, region, and whether the content is from Esri or is marked as Authoritative. Use the drop-downs to narrow your search. You can share your filtered search results with others by copying the URL at the top of the page.
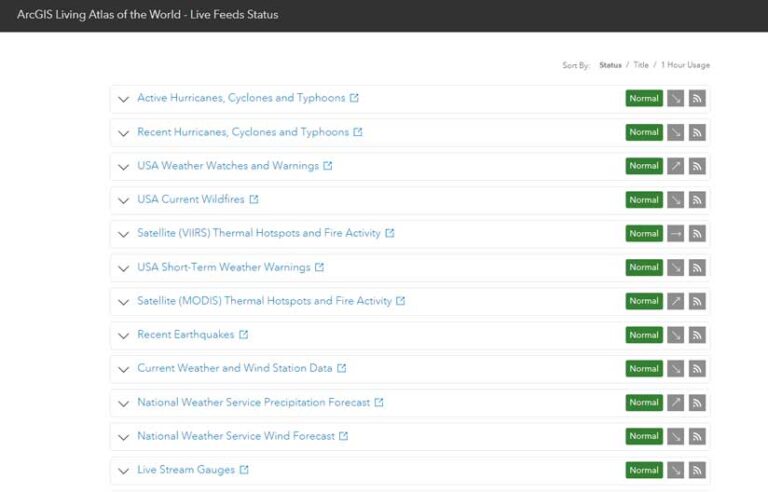
8. Make your maps come alive using live feeds.
ArcGIS Living Atlas includes authoritative live feeds that help you monitor and learn more about current and predicted conditions. These cover a broad range of topics such as earthquakes, wildfires, weather, thermal hot spots, and streamgauges. View all authoritative live feeds at https://www.esriurl.com/LiveFeed.
To provide more visibility and transparency for the current status of these feeds, the ArcGIS Living Atlas team has developed the Live Feeds Status page (livingatlas.arcgis.com/livefeeds-status/). This page displays a summarized view of commonly used live feeds, showing the current status and usage trend, along with an RSS link to subscribe to notifications.
The live feeds are updated every few minutes to every few months, depending on content and source; view the item pages for update details. Live feeds are implemented using the Aggregated Live Feed methodology (links.esri.com/LiveFeedMethodology), a proven technique that you can implement for your own feeds.
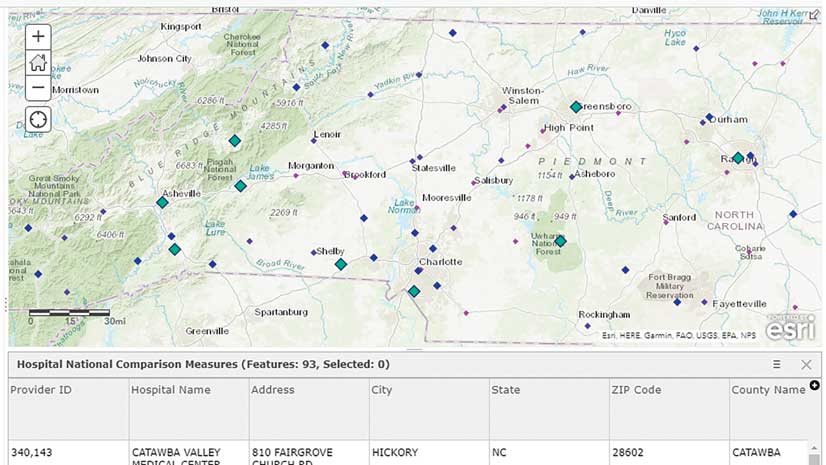
9. Use ArcGIS Living Atlas content for visualization and analysis.
ArcGIS Living Atlas provides access to apps, tools, and high-quality GIS data that can be used to visualize events or perform analysis. Analysis can be performed directly in Map Viewer, ArcGIS Image for ArcGIS Online, and ArcGIS Pro.
Use ArcGIS Living Atlas layers to perform spatial analysis, such as buffering, overlay, and proximity analysis. Aggregating point data and missing geographic boundaries? ArcGIS Living Atlas has a collection of ready-to-use boundaries for your work that can be accessed from the Boundaries drop-down on the Browse tab.
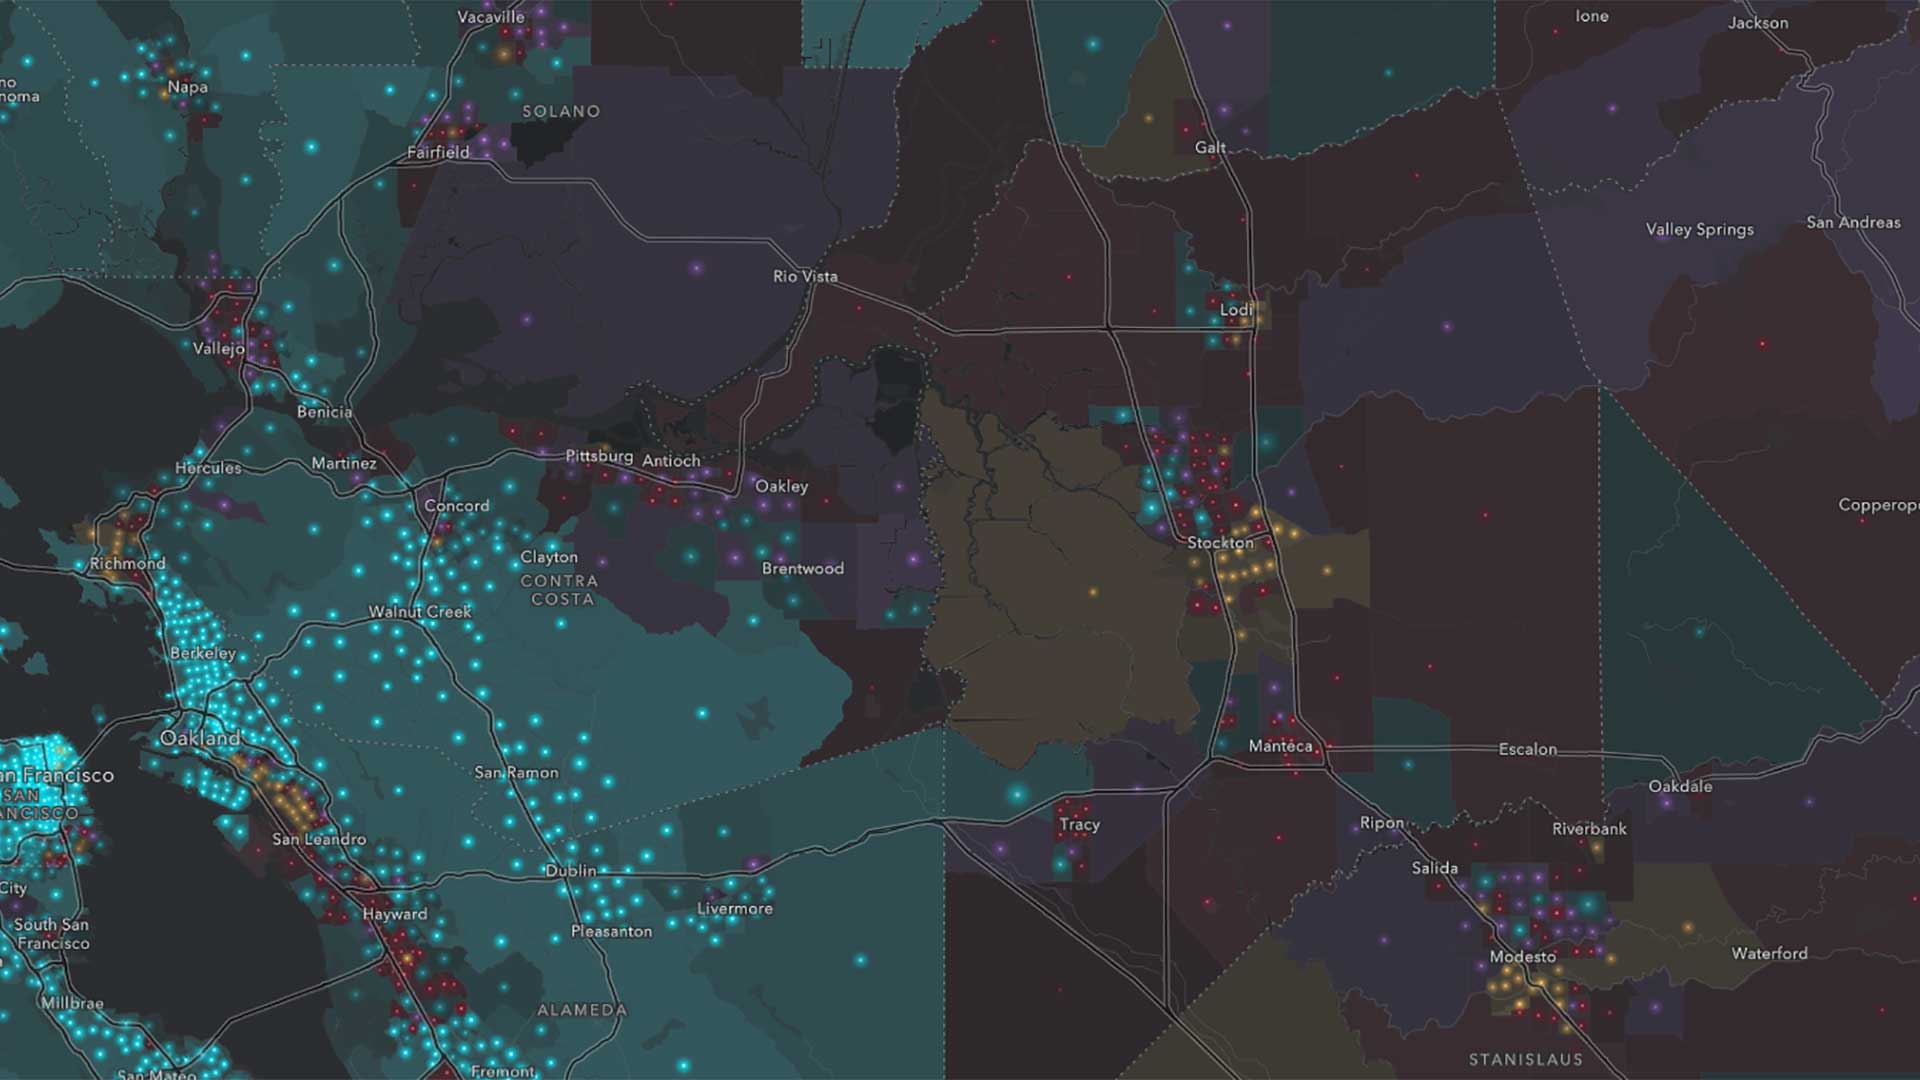
ArcGIS Living Atlas includes a wide and comprehensive range of demographic data that can be used to understand your community, perform site selection, locate facilities where they are needed, and enrich your own data. See all ArcGIS Living Atlas demographic content by clicking the Demographics drop-down on the Browse tab, or take the Learn about your community using Census ACS layers in ArcGIS Living Atlas tutorial at links.esri.com/ACStutorial.
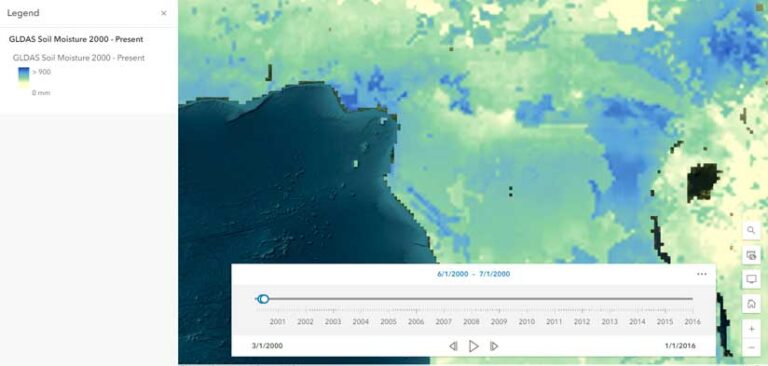
Key environmental data, such as elevation, soils and geology, land cover, climate data, and others found in ArcGIS Living Atlas can be used to assess environmental impact, understand ecosystems, view protected areas, evolve natural resource management, examine climate resilience, and more. See all ArcGIS Living Atlas environment content by clicking the Environment drop-down on the Browse tab.
Use various types of multispectral and multi-temporal imagery to view land use and land cover, understand change over time, and use different processing templates to focus on specific information.
Access pre-trained deep learning models to extract specific features of interest from imagery or use raster function templates to enhance imagery or create intuitive visualizations over time. See all ArcGIS Living Atlas tools at links.esri.com/LAtools.
10. Contribute to ArcGIS Living Atlas.
You can contribute to ArcGIS Living Atlas by participating in the Community Maps Program (communitymaps.arcgis.com/home/). Organizations around the world contribute their local geographic knowledge to the Community Maps Program because they understand that an accurate and useful basemap foundation is of paramount importance.
Contemporary basemaps ensure the creation of higher quality information products and support better decision-making. Participating organizations can access to a rich collection of accurate, beautifully styled basemaps created by authoritative data providers and GIS users around the world, provide feedback, edit features, and share data to contribute to the greater GIS community.