The night Helene hit Asheville in September 2024, we felt secure. We had a couple of jugs of water, stocked up the fridge on (very perishable) food, and made sure the grill had a full propane tank. We assumed we’d lose electricity for a few hours. My dad had been visiting that week, and while the news had some coverage about the forthcoming storm, the reporters didn’t seem to be alarmed, so neither were we.
The next morning, I woke up to my husband yelling from the living room for me to get out of the bedroom—the room closest to the large pines in the backyard. I tried to turn on my light, but nothing happened. From 5:00 a.m. until noon, we sat in horror and awe as trees battled to stay upright in gusts upwards of
50 miles per hour. We hunkered down and got ready for a day without electricity.
We lost water. We lost cell service. Then, we ventured out and saw for the first time the incredible scope of destruction and death. The panicked scramble to reach our friends and call our families began.
Two days later, we found ourselves risking the gasoline to try to find a way out. Interstate 40 had collapsed on the west and was blocked by a landslide to the east. North of us, Interstate 26 had collapsed or was covered. We went south, into the path the hurricane’s destruction. Dodging landslides and downed trees, we made it first to Greenville, South Carolina. From there, we drove through Atlanta, then Chattanooga, and finally made it to Nashville.
With connection to the outside world restored, images and video documenting what we’d just left behind began to pour into our phones. I found myself glued to social media, looking for official information about plans and resources but finding none.
Planning for a Changing Climate with GIS
It’s tempting to believe that Helene is the pinnacle of natural disasters that nature can throw at us, but it isn’t. The reality is that the climate is changing, and we (as a global community) must plan appropriately.
Nashville, well-seasoned in responding to natural disasters, has done just that. The city doesn’t just have a climate action plan in the form of a PDF document. City staff have communicated the plan brilliantly through a story created with ArcGIS StoryMaps. The app is public and, therefore, so is the data. This fosters meaningful collaboration and transparency and helps operationalize this information.

In my professional life, I champion the use of spatial technology to support understanding, planning, and action, particularly where it pertains to the work of my beloved community of environmental professionals. I have the honor and privilege of seeing amazing, life-saving implementation of these tools every day.
But also, right now, I know we can do better. We can do more. And there is simply no excuse anymore to not fully leverage this technology.
Preparation
Let’s stay in Nashville for our first example. Kendra Abkowitz is the senior director of sustainability and resilience with the mayor’s office at the Metropolitan Government of Nashville & Davidson County. Abkowitz told local TV station WKRN that the main goal behind the story the city created with ArcGIS StoryMaps is “better equipping Nashvillians with information and starting a conversation so that the next time we do have an extreme weather event hit us here in the city . . . we are well informed and we’re better prepared to be responsive to it.”

Response
Geospatial artificial intelligence (GeoAI) has also played a significant role in the response to Hurricane Helene. For example, the United States Geological Survey (USGS) created the Hurricane Helene Landslide Observations Dashboard with ArcGIS Dashboards. The tool is simple on the front end, but the points you see are derived from information extracted from satellite imagery and analysis. As the earth observation industry expands, so too do its practical applications for the data.
Recovery
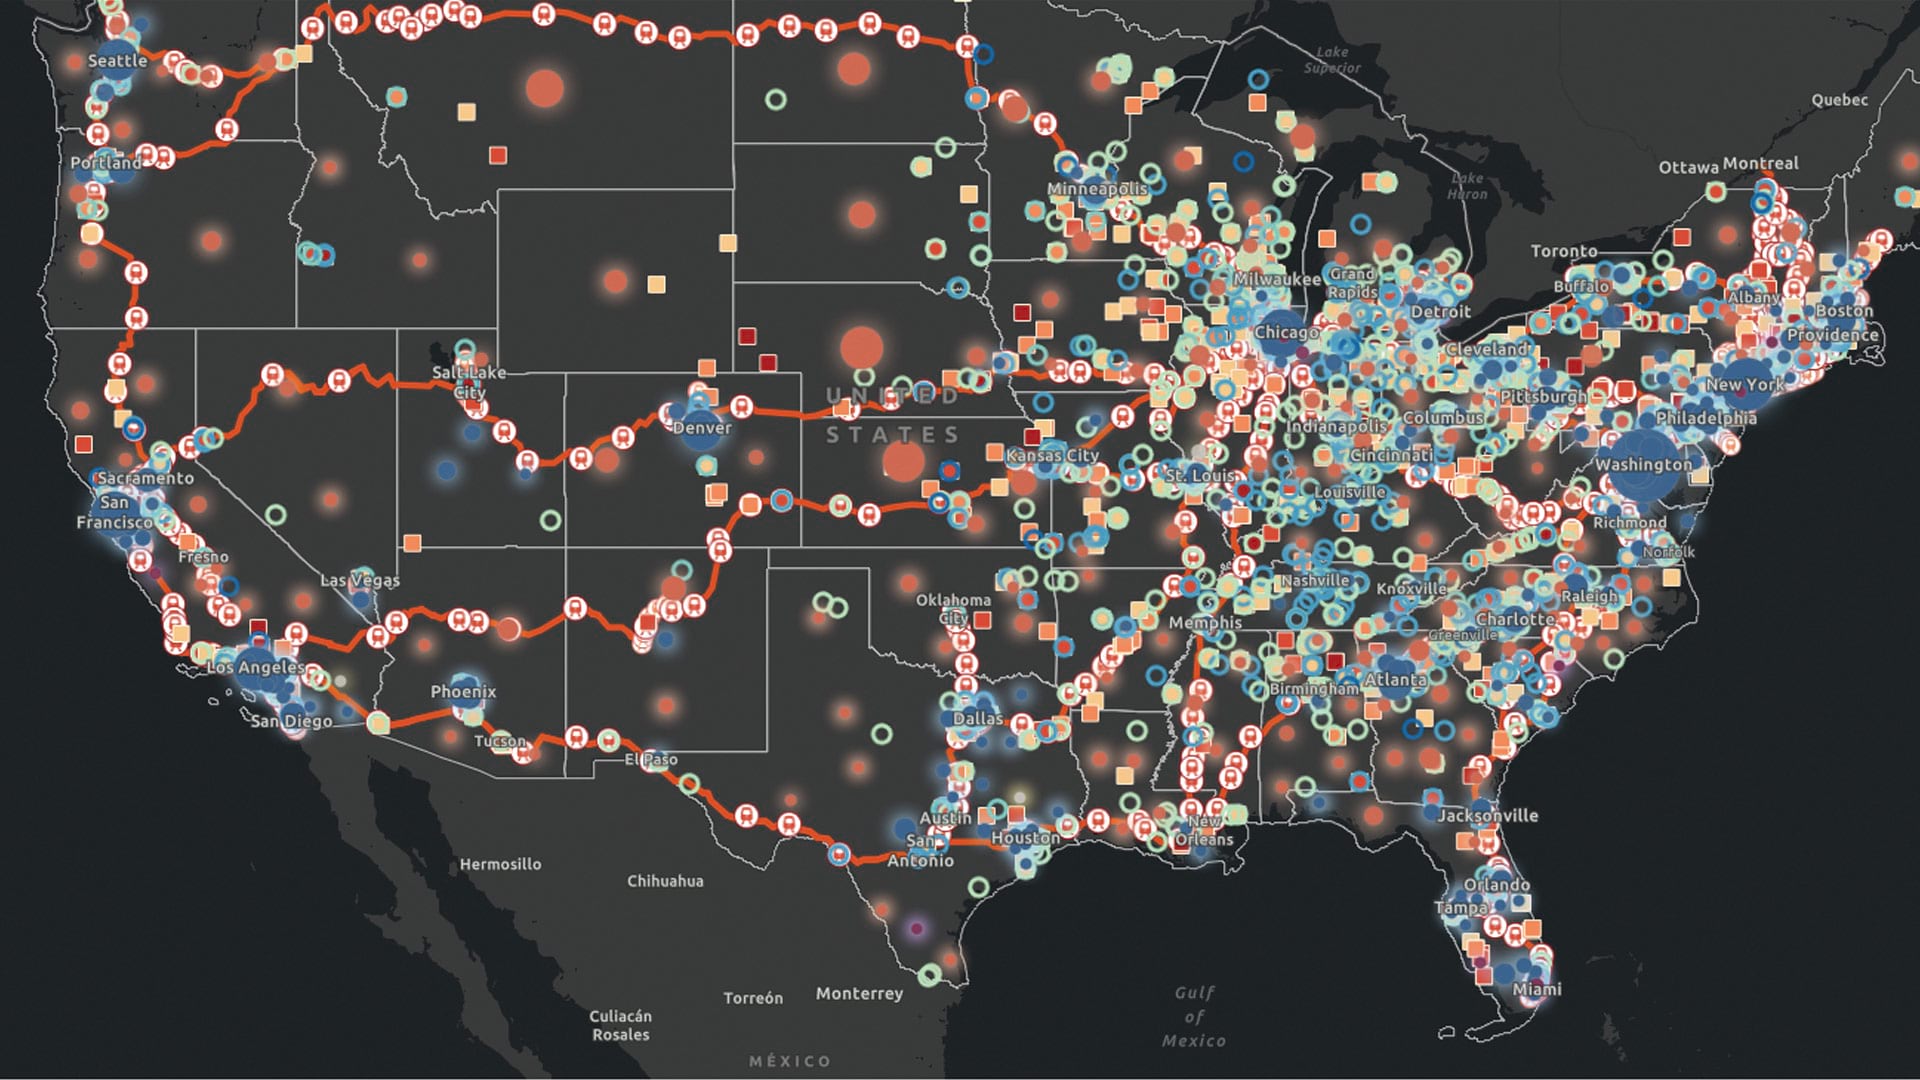
Recovery can mean many things for a community. Whether in recovering ecosystems, restoring assets, or rebuilding the social fabric of a community, GIS plays a role. One thing that struck me during my experience with Helene is the number of public inquiries about location. Where can we get gas? Where is there electricity? Where can we go to get water and food? Where are my loved ones? For answers, people find maps intuitive.
In Santa Rosa, California, after a 2017 wildfire, the city used ArcGIS to provide public-facing, near real-time updates on recovery of city infrastructure.
Mitigation and Adaptation

The reality we now face is this: At some point in all our lives, if we haven’t already, we will experience the consequences of a major natural disaster as a result of worsening extreme weather patterns. The Environmental Protection Agency (EPA) Climate Pollution Reduction Grants program provides nearly $5 billion in grants to states, local governments, tribes, and territories to plan and implement climate action plans. Too many times, climate action plans are released as a PDF and not operationalized across a government’s operations or used to support community action.
However, the number of public-facing maps and apps for climate action planning is growing. The Northern Virginia Regional Commission has developed an app that covers numerous local climate-related issues with open data and maps to help others explore and understand subjects such as heat islands and land use. And the City of Falmouth, Maine, used a map-based application to enable the community to provide comments, place them on the map, and upvote user-submitted ideas. This ensures that the community is able to give feedback throughout the entirety of a process, not just at the beginning.

What We Can Do Now
Helene is derived from Greek for “shining light.” My hope is that our experience with Helene serves as a beacon, a wake-up call to governments everywhere and of every size to take action now. Make plans ahead of time and embrace GIS technology to collaborate and communicate. Leverage the technological resources that you already have. Use them to their full potential.
Dodd Galbreath, the director for the Institute of Sustainable Practices at Lipscomb University, said, “As someone who has served on various regulatory boards over the past 30 years, I encourage all citizen representatives on these boards to love their neighbor. This means having to courageously and frequently say no to those who want to make it easier for people to buy, invest their livelihoods, and put all they have . . . at risk in a floodplain.”

Data-driven decision-making that incorporates environmental knowledge to tell people no and to illustrate why and where is a compassionate action. Create a solid data-driven climate action plan that includes all aspects of your city: social, environmental, and economic. Stick to it. Say no when there is pressure to ignore the plan. Do it as an act of love for your fellow human. One poor decision may or may not have much consequence, but a series of poor decisions can cost hundreds of lives and billions of dollars and destroy entire regions overnight.
If you need assistance right now in response to any disaster or crisis, please visit Esri’s Disaster Response Program page. When you need help quickly, Esri can provide data, software, configurable applications, and technical support for your emergency GIS operations. This program will ensure that you get the help you need to understand the situation, make better decisions, and respond more effectively during a crisis.
To learn more about how GIS can help you develop, enhance, and operationalize your climate action plan, visit our Confronting the Climate Crisis page.