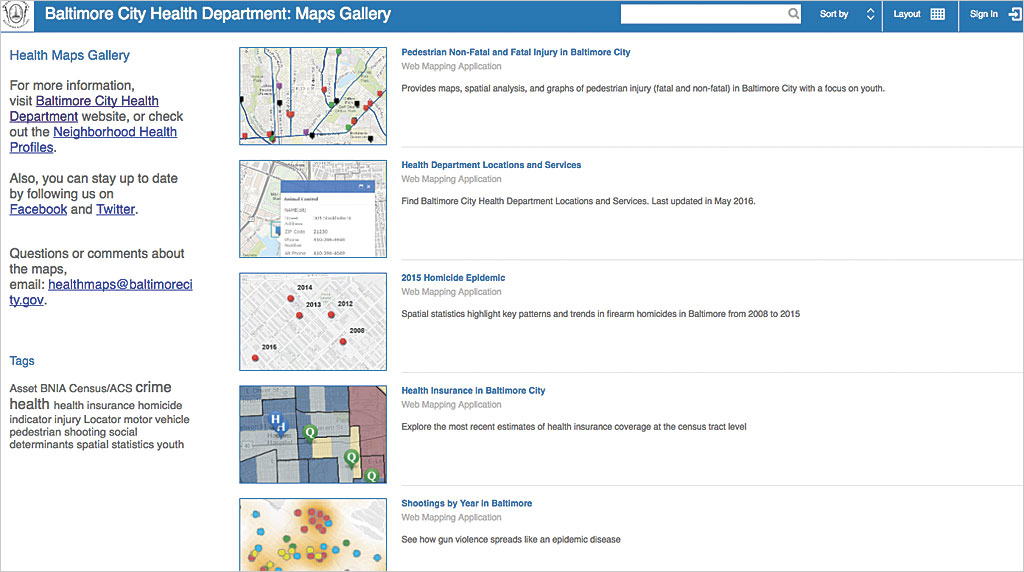
A web map gallery on ArcGIS Online showcases the work of your organization. The authors provide best practices for creatin g and launching your own web map gallery so you can share your work throughout your organization and raise the profile of your GIS program. They also include tips that will help you make the most effective use of mapping products in your organization.
At last, you are ready to take the big step of releasing an online web map gallery for your organization using ArcGIS Online. This article describes what we learned when we launched a map gallery for the Baltimore City Health Department using ArcGIS Online. In these eight tips, we share the lessons we learned. We hope they will inform your processes and make publishing your own gallery a successful venture.

1 Define the purpose of the map gallery.
Clearly define the purpose of the gallery. It should align with your organization’s mission. The Baltimore City Health Department wants all Baltimoreans to benefit from knowledge, access to health services, and an environment that will enable healthy living, so the map gallery supported that mission.
You should be specific and involve your main stakeholders. Always ask who are the audiences for your gallery are. How do you expect your audiences will use your maps? Engage stakeholders as early as possible to make sure your efforts are parallel with their efforts.
Our stakeholders are Baltimore City residents and the senior leadership of the Baltimore City Health Department. The goals of our map gallery are
- To provide the public with interactive maps and spatial analyses of health and health-related topics.
- To update data and tools available to the public on our website.
- To increase awareness of health-related topics, problems, and potential solutions and help move Baltimore City toward public health action.
2 Create a written plan.
Putting together a written plan will help coalesce your ideas for the map gallery. The plan can be brief and should describe the logistics of the gallery, the personnel and costs associated with it, the process for creating and reviewing it, and the number of maps in the gallery and frequency with which maps will be published and updated. The plan should have a timeline for potential projects in the short, medium, and long term and should include a brainstorming section. Even if you are not asked to provide a plan, having one to reference and revise will be helpful. Solicit feedback on the mapping projects that interest your leadership.
Our map gallery plan is brief, but it has grown since its inception. We update it regularly, refer to it often, and use it to brainstorm new ideas. It is our compass. Our list of map projects is structured as a timeline with three different project lengths.
- Short term—Estimated two-week turnaround time or less for one map
- Medium term—Three to four weeks
- Long term—Four or more weeks
Tip: Esri evangelists recommend using the phrase “spatial analysis” instead of “mapping” when speaking to others about your plan. Mapping implies something more passive—just placing items on a map—while spatial analysis is more active and informative.

3 Develop a product line.
Define the types of maps and map-related products you will offer. Many people have not been exposed to sophisticated map products, such as Esri Story Maps apps, so they may not appreciate the potential of these products at first. People are familiar with Google Maps but can’t imagine much else.
There are several ways to address this. Show them examples of maps that you’ve created. Invite them to explore the Esri Story Map Gallery or the Esri Web Application Template page. Have them look at Esri’s GitHub repository. Esri also offers a map gallery template and examples from organization home pages and portals as well as tips for configuring galleries in ArcGIS Blog posts.
Consider which of these types of maps and map products will be attractive to your target audience:
- Descriptive maps show location, phenomena, area, counts, rates (of disease for example), risks, or protective factors or can demonstrate spatial analysis and hypothesis generation. This type of map can reveal patterns and trends and make use of spatial statistics and regression.
- Esri Story Maps apps combine maps with text, images, and video to form a compelling narrative. They can also be used as a directory for services to assist in finding the nearest location of a specific type (hospital, clinic). They can also locate assets, maps, services, or organizations.
- Routing maps can show how to get to a location and how long it will take for a given mode of transportation.
Esri has templates to accommodate many types of maps, and the list is growing. Take time to understand the differences between a simple map, a web map app, and customized web maps (with or without additional programming). Consider your organization’s current and future internal capacity to create maps, which staff members should be responsible, and which staff members are skilled enough to modify existing templates as needed. You may want to use field collection and crowdsourcing apps such as Collector for ArcGIS and Survey123 for ArcGIS. We hope to incorporate these apps into our work in the future.
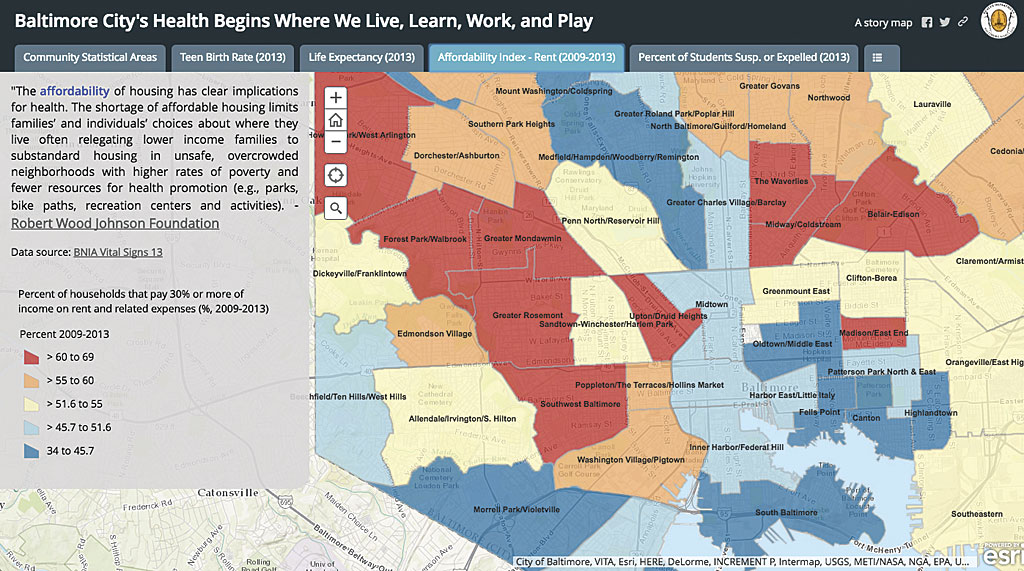
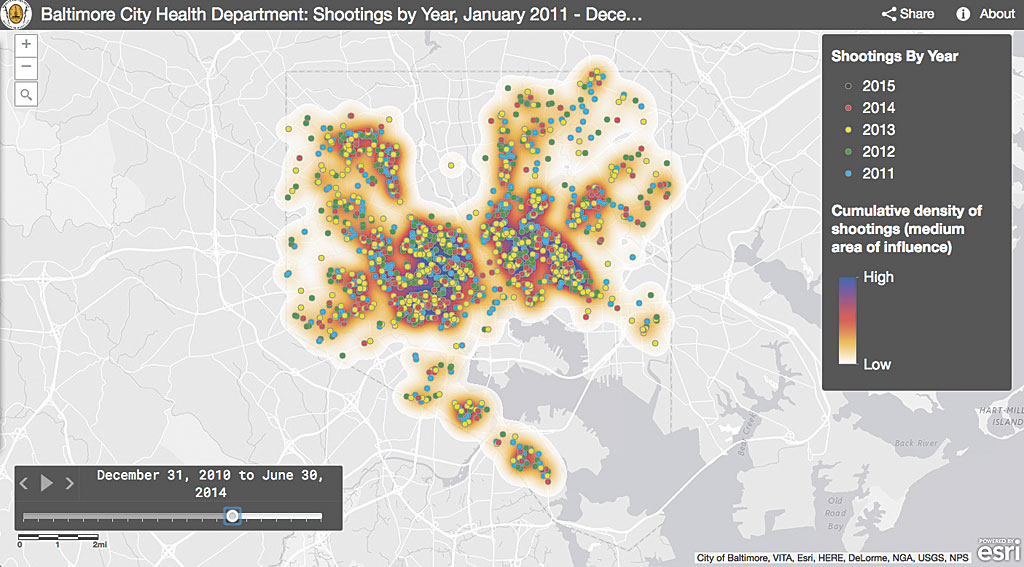
If feasible, use a variety of templates in your gallery. The six maps in our gallery use the Story Map Series (twice), Story Map Journal, Filter, and Time Aware map templates. We have also embedded a map within a map. (For information on embedding a map in a map, see the ArcGIS Blog post “Embedding a Story Map within a Story Map.”
When choosing a template, ask yourself which map template is most appropriate for the goals of your map and does the template match your data in terms of form and function?
In your map gallery plan, you may want to include a short paragraph describing ArcGIS Online, noting its ability to be viewed on any computer or mobile device (smartphone or tablet) and security features such as password protection of maps prior to publication.
You could also develop a checklist for your organization that covers map elements, the development of standard templates, and your practices for publication. We’ve found that such a checklist ensures standardization and facilitates the review and release process. We developed our checklist based on our personal map design preferences, an ArcUser article entitled “Make Maps People Want to Look At: Five primary design principles for cartography” by Aileen Buckley (Winter 2012) and the article “What All Good Maps ‘Should’ Have,” available from the Western Washington University website.

4 Verify that you can release this data.
As you develop your map gallery plan, recognize that geospatial data is inherently specific and revealing, so the way you share information should be an important concern for your organization. Make sure you are following best practices for your field and GIS. For data that is confidential but aggregated, there are multiple considerations. Should this data be publicly released? Does it follow applicable laws and regulations? Is it statistically valid? Does it avoid stigma? When appropriate, include disclaimers or limitations about the accuracy of a map.
For our initial online maps, we chose to use existing open data sources such as Open Baltimore, the Maryland Department of Planning, and the Baltimore Neighborhood Indicators Alliance to highlight relevant health challenges in Baltimore City. In the meantime, we are working on longer-term projects using health data that will be aggregated. Prior to release, all maps are reviewed by several layers of leadership including our public information officer (PIO).
5 Encourage feedback.
Feedback makes your map better. Every map and map gallery should go through an informal or formal feedback and review process before publication, whether it is for internal use or public release. Assemble a small group of coworkers (both GIS and non-GIS users) who can provide feedback via e-mail or a brief online form (e.g., Google Forms). Consider asking questions such as “How easy was the map to use on a scale of 1 to 5?” or “What suggestions do you have for improving the map?”
The process of internally reviewing and promoting your map will provide valuable feedback before publishing. We have found the process to be helpful because it reveals errors both big and small, and it is generally not too time-consuming. This process will often uncover mistakes that can be easily fixed and will improve the user’s experience.
6 Craft a rollout plan.
Creating a rollout plan will help facilitate mapping workflow and publication. Consider doing a soft launch first so that you can troubleshoot small errors and (hopefully) avoid larger ones. Create a social media toolkit and one-pager to share with your PIO and the press. Also, reach out to your network of map professionals at partner organizations for their help with publicity and sharing your map gallery and maps. When you have developed at least three or four maps for a public gallery, consider sharing them with the media to kick off the gallery.
Some additional suggestions could include:
- Working with your PIO on a national or local news story. In our case, a local Fox News affiliate wrote a short story and embedded the maps in its website for readers.
- Work with your PIO to explore the possibility that a civic or tech organization will write or blog about your map gallery.
- Ask your local, state, or federal GIS or open data agency to host a link to your map gallery.
- Promote the map gallery via your organization’s social media accounts.
Don’t forget to promote your map internally. Include an announcement about the map gallery in newsletters and create slides for leadership that can be distributed at community meetings or other types of events. Include the map gallery in your online and printed reports.
If you find this kind of promotion challenging, try to remember that if your map gallery has operational value, failing to promote it internally will mean it won’t garner enough users to make a difference. For map galleries with public audiences, keep in mind that if your organization’s staff are unaware of the gallery, they could be caught off guard when interacting with stakeholders and the public.
7 Engage your leadership on how to use maps.
You may be charged with briefing your organization’s leadership on how to use maps and map products. Further, your leadership may want to use those same maps to help them communicate with other stakeholders. Possible uses of your maps include:
- Public or stakeholder meetings to demonstrate a problem and/or its solution
- Decision making and planning by your organization, government agencies, community groups, and the private sector
- Conversations with funders
- Funding applications and reports
- Evaluating and monitoring a program or project
In addition, it is also important to brief members of your leadership on the map gallery’s accomplishments and bring its needs to their attention as appropriate. Maps are a compelling way to break down silos within and between agencies.
8 Make feedback easy to give.
We recommend creating a separate specific organizational email account for map viewers to send feedback and adding this email address to the maps and map gallery. Metrics that monitor the hits on a map gallery is useful, but ultimately qualitative feedback is more important. You need to understand who is being informed by your maps and what actions are undertaken as a result of that information.
Tip: Keep a running list of map ideas as more ideas begin to surface so as not to forget them.
Conclusion
We hope our lessons learned will be helpful as you begin to develop or refine your own map gallery. Be sure to check the Learning Plans specific to development on Esri’s new training page. Our map gallery will continue to be an important component of work at the Baltimore City Health Department. We are also seeking to develop it further with business and nonprofit partners in a recently launched Baltimore TecHealth Initiative—Transforming Engineering for Civic Health.
For more information, contact Jonathan Gross, epidemiologist for the Baltimore City Health Department.
Online Resources
Here are some online resources used by the Baltimore City Health Department in creating and launching its map gallery.
These sites will help you educate stakeholders and those in your organization about the types and uses of maps and provide ideas for galleries:
- Esri Story Map Gallery
- Esri Web Application Template Page
- Esri’s GitHub repository
- Esri Map Gallery for Local Government
To create its map gallery, the Baltimore City Health Department used existing open data sources to highlight relevant health challenges in Baltimore City such as:
To promote its map gallery, the Baltimore City Health Department:
- Worked with its PIO to get new coverage and on a local Fox News affiliate wrote a short story and embedded the maps in their website for their readers.
- Worked with its PIO to get an article or blog by a civic or technical organization and the department’s map gallery was the subject of a Technical.ly Baltimore article.
- Ask your local, state, or federal GIS or open data agency to host a link to your map gallery. In Maryland, it is Maryland iMap.
- Relationships with business and non-profit partners in a recently launched Baltimore TecHealth Initiative—Transforming Engineering for Civic Health.

