As part of an advanced GIS class at Ohio’s Miami University, students participate in a community service project that builds the students’ spatial thinking and problem-solving skills.

This project lets students apply GIS knowledge and skills while contributing to the community. Students are grouped into teams and paired with real-world clients. Each team helps the client identify its needs and collects and analyzes geographic data to deliver findings that assist in client decision-making.
In spring 2016, the class worked on a 14-week project for the City Gospel Mission. Founded in 1924 by James N. Gamble of Procter & Gamble, City Gospel Mission helps the homeless break the cycle of poverty and despair. City Gospel Mission is in the process of launching JobsPlus, a job readiness and placement program. The students’ work would help answer the question, Where can JobsPlus clients find meaningful, sustainable employment that doesn’t require personal transportation?
Analyzing Employment Opportunities
The level of employment, the quality of jobs, and jobs access are critical components of economic development in a region. Public transit provides crucial means for people—especially those who are aged, poor, or disabled—to access economic opportunities and other resources.
It is important to understand ultimately how well transit aligns with where people work and live. How effectively transit connects people and jobs is critical for job placement programs. It is also important to the delivery of services by government departments and business.
The JobsPlus program prepares people—especially people in poverty—to find and keep jobs. To launch its classes, grow its network of area employers, and assist its graduates, JobsPlus needed to know where its attendees could find meaningful, sustainable employment that did not require personal transportation.
The students would use GIS to help JobsPlus answer this question by locating employers and employment opportunities in Butler County and evaluating the accessibility of these opportunities to public transportation. Acceptable accessibility would require no more than a 20-minute walk to a bus stop. The students’ analysis would not only reveal the spatial pattern of job opportunities but also the spatial trend of regional economic development when compared with the concentration of employers in the county.
Obtaining Data

Students acquired a list of employers for the municipalities located in Butler County from the Butler County Chamber of Commerce. That list contained the company name, owner, street address, telephone number, and other information.
Job opening data for the county, provided by JobsPlus, was derived from a list of all jobs in Ohio compiled and distributed by the Ohio Means Jobs program every two weeks. Students collected the data from December 2015 to February 2016 and extracted the job openings located in Butler County.
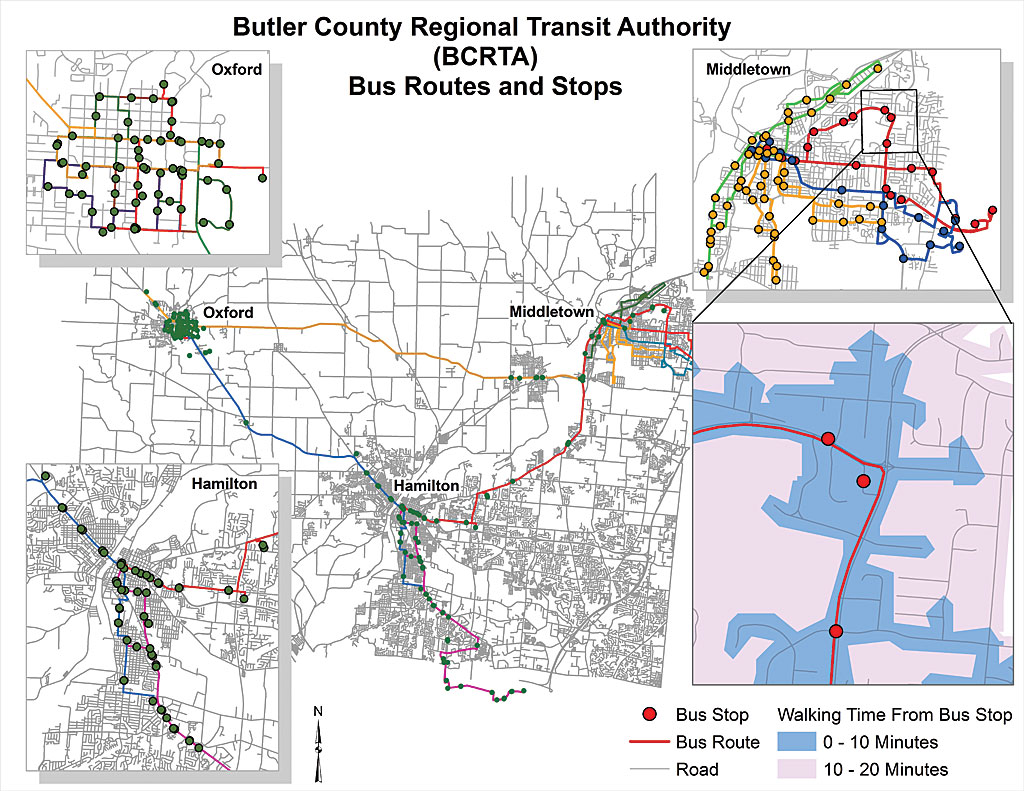
Public transit routes and stops data was obtained from the Butler County Regional Transit Authority (BCRTA), which provides a geodatabase containing a route dataset of regional connectors and local routes, a point dataset of all bus stops in Butler County, and a network dataset of Butler County roads.
Students also examined the population density in Butler County to better understand the labor force and public transit demand in the area. US Census Bureau 2010 census block group level data was used. A census block group, generally defined to contain between 600 and 3,000 people, is the smallest geographic unit of population that can be downloaded from the Census Bureau website.
Spatial analysis and mapping were done in ArcGIS 10.3 for Desktop. Street addresses for employers and new jobs provided in tabular format were geocoded to Butler County roads and mapped as points and density surfaces. The ArcGIS Network Analyst extension was used to determine 10- and 20-minute walking distances from the bus stops along roads. Public transit accessibility of employment opportunities was evaluated based on the walking distance to employment opportunities in relation to bus stop locations.
Where the Employers Are
Of the 995 employers successfully geocoded in Butler County, 384 are in the City of Hamilton, 249 in West Chester Township, and 187 in the City of Middletown. These municipalities account for 86 percent of the employers in Butler County. When mapped with 2010 population density, employer locations showed some spatial alignment with population distribution. Two employer hot spots—Hamilton and Middletown—are the most populous areas in Butler County and have traditionally been manufacturing centers. Another area with a high employer-to-population ratio is West Chester. Unlike Hamilton and Middletown, West Chester doesn’t have high population density. This suggests a separation between the business district and residential areas. Miami University in Oxford has a high population of students and was the only employer in Oxford included in this analysis.
Where the Jobs Are

The ability of businesses to create new jobs and hire new employees varies depending on their type and size. From December 2015 to February 2016, 303 new positions were posted in Butler County. The number of jobs was not proportional to the number of employers across different areas. Employers in West Chester posted the largest number of new openings (67), followed by Fairfield (37). Hamilton and Middletown together posted only about one-quarter of the new jobs in Butler County.
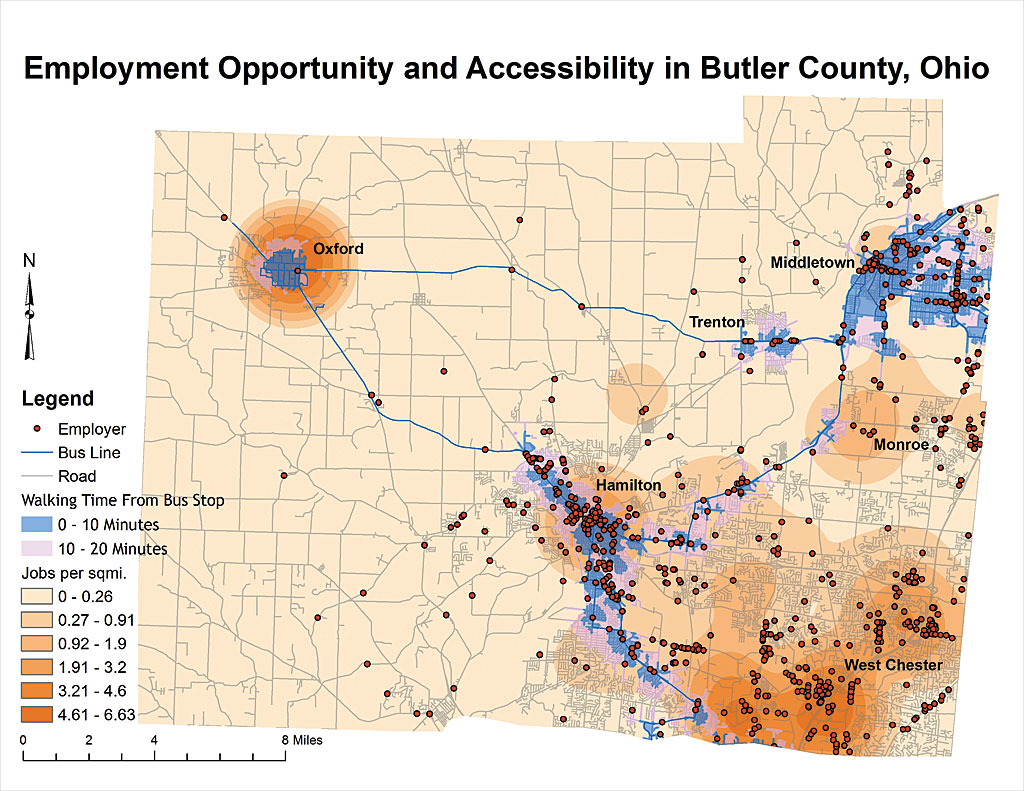
A density map can reveal the spatial distribution of new jobs better than a dot map. The density surface map the team created revealed two pronounced hot spots in Oxford and West Chester. All new jobs in Oxford were generated by a single employer, Miami University. New jobs in West Chester came from a variety of employers and ranged from housekeeping to business intelligence development. The diverse employment opportunities in West Chester suggests that it has an expanding business sector and is experiencing economic growth.
When population was considered, West Chester exhibited greater job creation potential with 1.1 positions per 1,000 people on average, while Hamilton and Middletown offer only 0.5 and 0.39 jobs, respectively, per 1,000 people. Despite the concentration of employers and population, these historically industrial cities have been in decline since the 1970s.
Public Transportation Accessibility
Finding a reliable means of getting to work daily is crucial for people to gain and sustain employment. JobsPlus program attendees often lack the resources to own or operate a personal vehicle. Fortunately, the BCRTA public transit system serves the county through four regional connectors and two local routes. In 2015, BCRTA provided over 525,000 rides, primarily serving Middletown, Hamilton, and Oxford.
The BCRTA public transit service area was evaluated based on the walking distance to the bus stops along roads. Distances were calculated based on a walk of less than 20 minutes along a road. Based on prior published empirical research, the project team used a value of 4.5 feet per second (or three miles per hour) as the walking speed of an average person. The area within a 20-minute walking distance was defined as the accessible distance to the BCRTA bus system.
The accessibility to employment opportunities was evaluated by overlaying employer locations, bus lines, and walking distances from bus stops. The map reveals an unbalanced distribution of employment opportunities and public transit service. West Chester is substantially underserved by BCRTA bus lines. Only four of more than a hundred employers and 3 of 67 new jobs in West Chester are located within a 20-minute walking distance from a bus stop.
In contrast, most employers in Hamilton and Middletown were located within walking distance to bus stops. These two cities also had greater job accessibility compared with West Chester. Further spatial analysis also revealed that residents in Middletown face relatively longer walks to new jobs than to existing employers, which suggests recent economic activities in the city are occurring outside the established area where existing employers are clustered and served by bus lines.
Placing a New Job Readiness Class
After examining Butler County employment opportunities, the student team concluded that West Chester had the strongest economic growth and job creation potential. However, the lack of public transit accessibility could be a barrier for job seekers without private vehicles. Although Hamilton and Middletown, two postindustrial cities, have highly concentrated employment opportunities and populations, they have low employment-to-population ratios because the number of manufacturing jobs has declined. People living in these depressed manufacturing cities need job readiness programs that prepare them to get and keep a new job.
Putting Information to Work
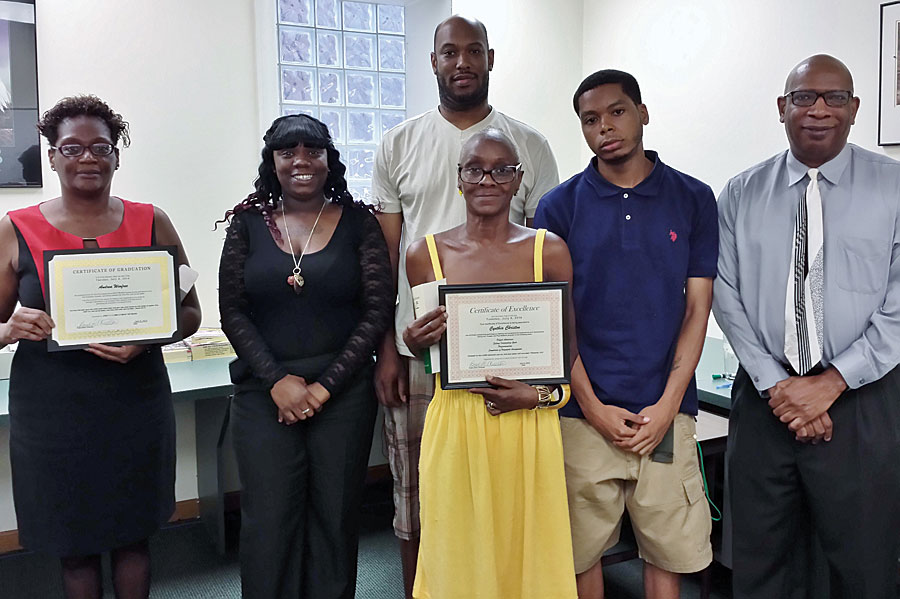
Guided by project maps, JobsPlus located and contacted businesses on or near bus lines and identified employment opportunity hot spots in Butler County. In fall 2016, JobsPlus launched a new office in Middletown. JobsPlus will continue consulting the spatial information produced by the project to broaden the scope of employment opportunities as it expands the program.
Miami students delivered high-quality outputs. One of the maps created from the project won second place in a professional map competition with more than 20 high-quality entries at an Ohio GIS conference.
Students who participated in this service learning project found it inspiring and fun and experienced a sense of accomplishment. The project enhanced public understanding of how geography and GIS help people make better, more informed decisions and make a difference in the world.
For more information, contact
Dr. Ziying Jiang, Assistant Professor, Miami University
Department of Geography
Department of Social and Behavioral Sciences
jiangz5@miamioh.edu
Acknowledgment
The author thanks Doug Dunlap, the director of JobsPlus in Butler County, for his advice and support during the planning and development of this project; and Ciara Childers, Nathaniel Ducklo, Maria Fagin, April Jones, Keegan McVey, Sarah Myers, Jordan Phillips, Andrew Sylvester, Jack Wantuch, and Therese Wantuch for their contributions to this project.

