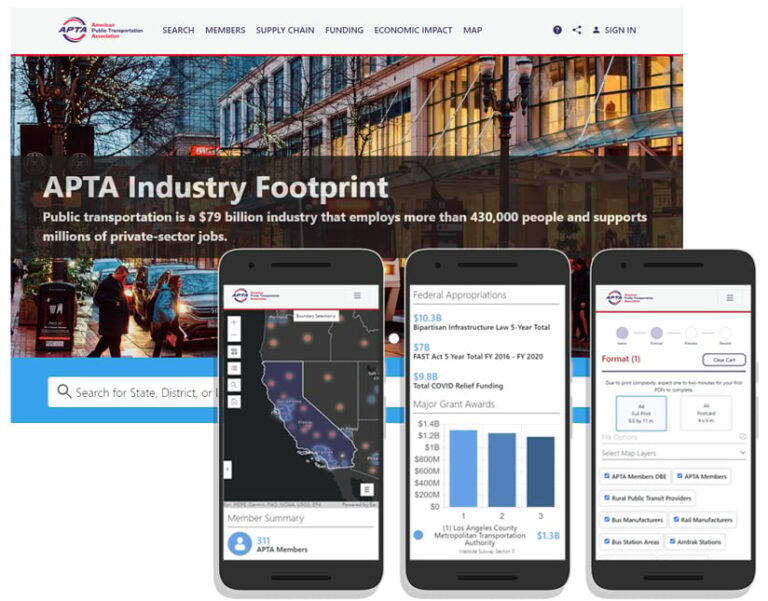
According to the American Public Transportation Association (APTA), public transportation is a $79 billion industry in the United States, employs more than 430,000 people, and supports millions of private sector jobs.
APTA, which supports and advocates for public transit initiatives, has long used ArcGIS technology to provide data analysis to its membership. This service evolved in the past few years into APTA’s Industry Footprint application.
“The application collects, analyzes, and presents key statistics at the national, state, and local levels,” said Matthew Dickens, senior director of policy development and research for APTA. “It provides insight into APTA membership, public transportation providers, transit services, transportation equipment manufacturing and the associated supply chain, and legislative contact information.”
The app, created primarily using ArcGIS Pro and ArcGIS Online, is used by the association’s 1,500 members as well as decision-makers to communicate information about public transportation projects, funding, and initiatives. With this information, the app helps APTA and its members communicate the significant impact of the public transportation industry across the country—the first step in advocating for more impactful and efficient
public transportation.
Building the App
To develop the application, APTA collaborated with two Esri partners. SymGEO, a Maryland-based company that specializes in geospatial data analytics, provided support for data development and cartography, while GeoMarvel contributed to application development and solution architecture.
“ArcGIS Online hosts all feature services and tabular data in the application,” says Kevin McMaster, principal at SymGEO. “An ArcGIS web map supplies the cartographic symbology pop-up information and design. All data analysis is performed in ArcGIS Pro.”
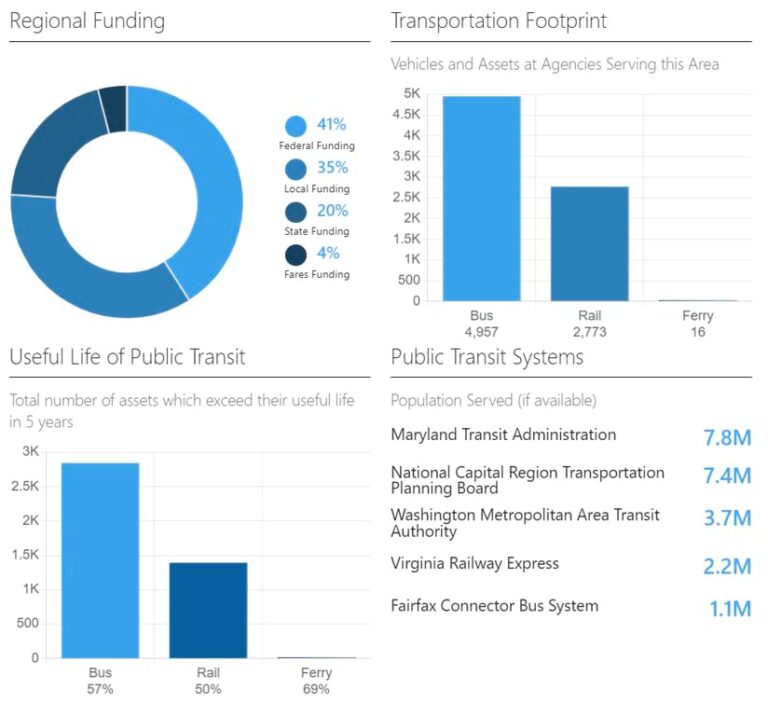
The Industry Footprint application retrieves data that has been preprocessed in ArcGIS Pro and uses the data to populate a series of graphs, charts, tables, and summary statistics for the user. A map-focused report is then created for the selected area of interest.

Data used in the app includes General Transit Feed Specification (GTFS) files, public transport equipment manufacturing locations, transit agency service areas, transportation grants, and current legislative district boundaries.
The GTFS data is used to distribute relevant information about public bus networks to riders in a series of text files.
“Each GTFS file includes a specific aspect of transit information including stops, routes, trips, and other schedule-related data,” said Jon Nordling, CEO of GeoMarvel. “To use this data, we collect all available GTFS feeds from municipalities or transit authorities using Python scripting and combine them into a single data layer to identify bus stop locations. We then buffer out those stops by a quarter mile to help identify gaps in bus stop coverage.”
The Public Transit Opportunity Index was developed based on population density, access to vehicles, household income, frequency of solo automobile commuting, traffic volume, price of fuel, and current use of public transit.
To better understand the populations that use public transportation, APTA employs Esri Tapestry Segmentation, a data portfolio that classifies and provides detailed summaries of communities throughout the United States. The classifications are divided into 67 distinct markets.
“The Tapestry data helps us gain a deeper neighborhood understanding and develop an engagement strategy,” said Dickens. “Details include gender, race, ethnicity, income, worth, and typical occupations. Combining these market profiles with housing information and population-growth data provides a comprehensive view of a region or locale.”
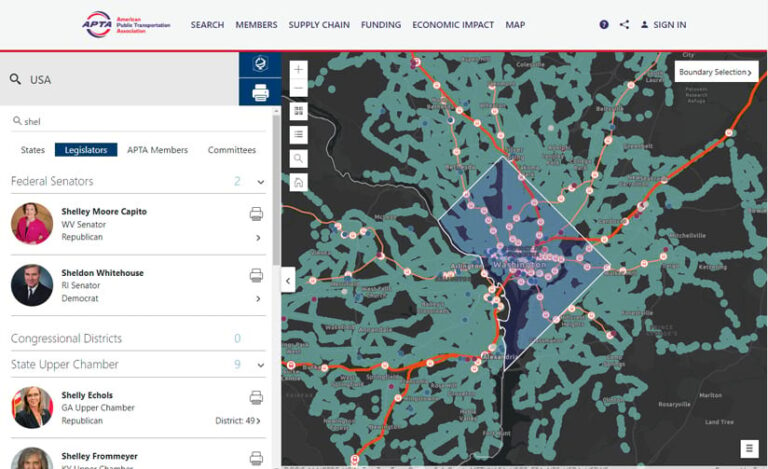
Search capabilities in the app include a number of selection options—local legislator, state, APTA member, or committee name. Based on the specific search, the app provides detailed spatial data and aggregated statistics.

The Road Ahead
The chief benefit of APTA’s Industry Footprint app is that it streamlines the search for information necessary for public transportation advocates as well as the public to paint a clear, cohesive picture of the current state of public transportation in their communities and in the United States as a whole.
“What would have taken days of research and analysis just a short time ago can now be accomplished in seconds,” said Dickens. “[This leaves] more time to share, discuss, and act on the information presented by the application.”
Of course, challenges arose during the process of app development. Nordling cited the volume of print requests that can occur during periods of heavy usage,
for instance.
“Monitoring the requests and confirming their completion was a technical challenge solved using innovative cloud architecture,” he said.
Maintaining the linkage between legislator data and the Industry Footprint app using application programming interfaces (APIs) in the event of an API failure was also critical. To solve this problem, the periodic download of all API data to Amazon S3 storage made it available to the user at all times.

“We are continually adding capabilities and enhancing features of the Footprint application,” said Dickens. “Our current focus is on improving the search experience for APTA members, and providing summary statistics for each member in the districts in which they are located. Advances in charting libraries and enhancing the mobile experience will continue to make the application more accessible to a wider audience.”
Dickens, too, emphasized that ease of access and accessibility were clear priorities for the app, noting that “the application brings best-available data from a wide variety of sources together, conducts detailed relevant analysis, and presents the results in a visually pleasing and compelling report format.”
Thus far, users of the application have lauded the extensive datasets available to them, which allow a wide range of analytical capabilities for the transportation industry.
“The Industry Footprint application provides a one-stop solution for public transportation policy advocates looking for information to present to legislative leaders and decision-makers,” said Dickens.

