For decades, the United States Census Bureau has published monthly reports about residential construction statistics. But this isn’t the only metric that can capture the pulse of America’s housing market. Since 1985, the National Association of Home Builders has published the Housing Market Index (HMI) on a monthly basis. This index is designed to reflect overall builder confidence in the housing market.
The HMI is derived from a monthly survey that asks single-family residential builders to evaluate three key aspects of the housing market: the current sales of new single-family homes, the anticipated sales of these homes over the next six months, and the level of traffic from prospective buyers of new single-family homes. These components are rated on an index with a threshold of 50. A rating above 50 indicates that most builders express confidence the housing market, while a rating below 50 indicates less builder confidence.
In August 2024, builder confidence fell to a rating of 39, the lowest it had been in nine months. This also marked the fourth straight month that this rating has declined. Current sales conditions dipped to 44 and traffic of prospective buyers fell to 25. For more than two years, these readings have been on a roller coaster, but the HMI has rarely exceeded 50, and has only maintained this level for a maximum of four consecutive months out of the last 26.
For perspective, during the six months leading up to April 2020 (the first month after the pandemic hit the United States), the HMI ranged from 71 to 76, indicating high market confidence. The HMI flourished in 2021 and the first half of 2022, peaking at 84. Since July 2022, it has never exceeded 56.
It doesn’t take a world-renowned economist to identify the key culprit of buyer (and developer) hesitation: the elevated interest rate. That isn’t the only problem, though. Housing affordability was a critical issue even before interest rates rose a couple of years ago. Much of the problem was driven by lack of supply as well as supply chain issues brought about by the pandemic.
As a planner, community development director, or municipal leader, you cannot fall into the trap of believing that today’s housing affordability crisis is strictly an interest rate issue and, therefore, out of your hands.
Location, Location, Location
Planners and municipal leaders are directly involved in housing policy for their city or county. Policies and zoning ordinances that were put in place prior to the 2010s are unlikely to meet the needs of current and prospective residents. Today’s generation of homeowners typically do not want access to exclusively single-family homes on large lots. The appeal of middle housing alternatives, such as townhomes, duplexes, and cottage courts, is strong because of both lower cost and maintenance.

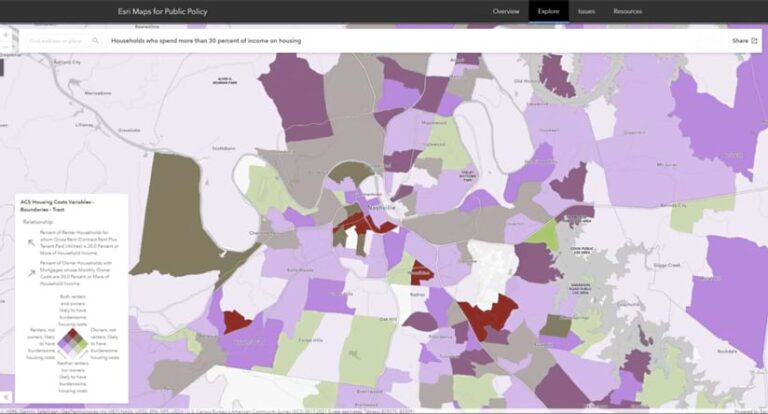
The first step in policy development is to gain an understanding of community needs. A free resource available to help determine this is the Esri Maps for Public Policy app in ArcGIS Living Atlas of the World. With over 800 curated maps, including 200 focused on housing, this app is an invaluable resource in taking a data-driven approach to policy development. Questions that these maps help answer include:
- What is the predominant number of units per housing structure, not including single-family detached homes?
- Where are the owned, rented, and vacant housing units in a specific neighborhood?
- What is the relationship between the median housing age and cost-burden housing?
- Where are the households that spend 30 percent or more of their income on housing?
A Geographic Approach to Implementing Affordable Housing
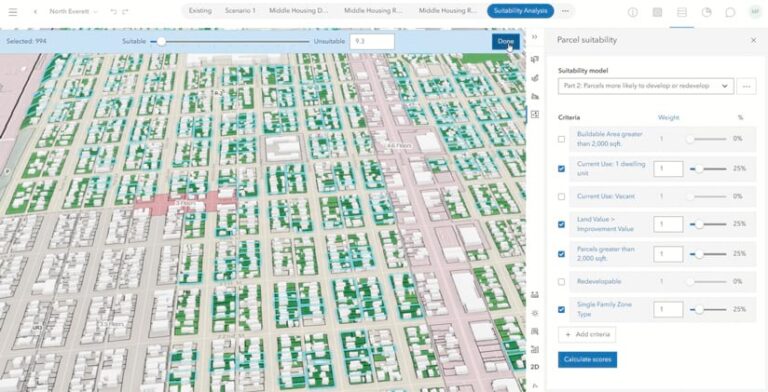
With an understanding of residents’ needs and struggles, planners can perform suitability analysis for affordable housing. Again, a data-driven approach is necessary because even the phrase “affordable housing” can trigger unhelpful political discourse. In other words, the specific sites for affordable housing cannot accurately be derived from anecdotal evidence or your feelings as a planner as to where it should be.
Tools within ArcGIS Urban allow planners to run parcel suitability analysis for a neighborhood or entire city. Determining which factors are involved and how suitability is measured is up to each municipality. Common suitability metrics include access to groceries, retail, education, and health services; transit options; ideal zoning regulations; parcel size and structure; and vacant lots with potential for purchase agreements.

This data-driven geographic approach changes the narrative in a municipality. The discussion becomes about the necessity of affordable housing units in certain locations, because of proximity to jobs and transit options, neighborhood revitalization, and more.
What Will It Look Like?
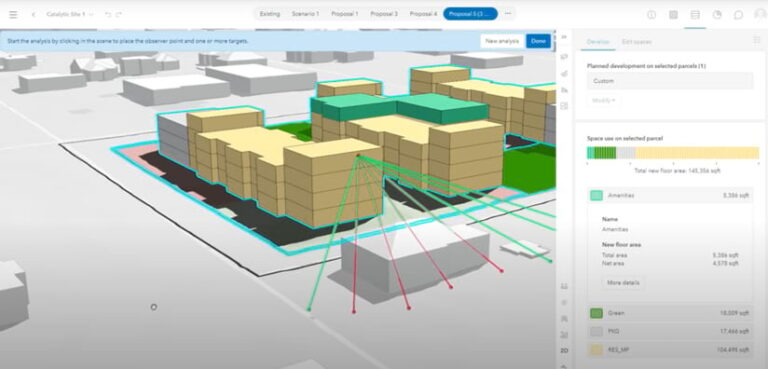
Finally, the design work can begin. Using ArcGIS Urban, planners can collaborate with developers to design housing and mixed-use developments that meet the needs of residents, while also being feasible and profitable for developers. This iterative scenario planning is a quick and cost-effective approach for planners and developers alike. They can both rapidly view the results of subtle or large changes and answer questions such as:
- Do we have the zoning regulations in place to accommodate mixed-use or compact, walkable communities? If not, what parameters (e.g., FAR, parcel coverage, permitted uses, building height, etc.) would that zone need to have to accommodate developers’ and residents’ needs?
- If we add a single floor to a development, how many residents will this add? How many additional jobs will it create in office spaces? In commercial spaces?
- What is the impact for a proposed development regarding tax revenue, utilities, transit, etc.?
- Will the development have issues involving line of sight and/or shadow impact that will negatively affect resident sentiment?
- How many potential units can we create if we require 10 percent of new homes in a district to be designated as affordable units? What would the fiscal impact be on the developer?

There is no simple fix for addressing affordable housing. There are also factors outside the control of planners, city administrators, and elected and appointed officials. However, these same leaders must put policies in place now that motivate and incentivize developers to meet residents’ needs. By leveraging GIS, planners and administrators can take a data-driven approach to identify suitable locations for affordable housing and work with developers to design developments that meet both community needs and market demands. This geographic approach not only helps planners make informed decisions but also changes the conversation around affordable housing from one of uncertainty to one backed by evidence and sustainable strategic planning. As the housing market continues to fluctuate, proactive, informed policymaking will be essential in ensuring that communities can thrive and remain accessible to all residents.


