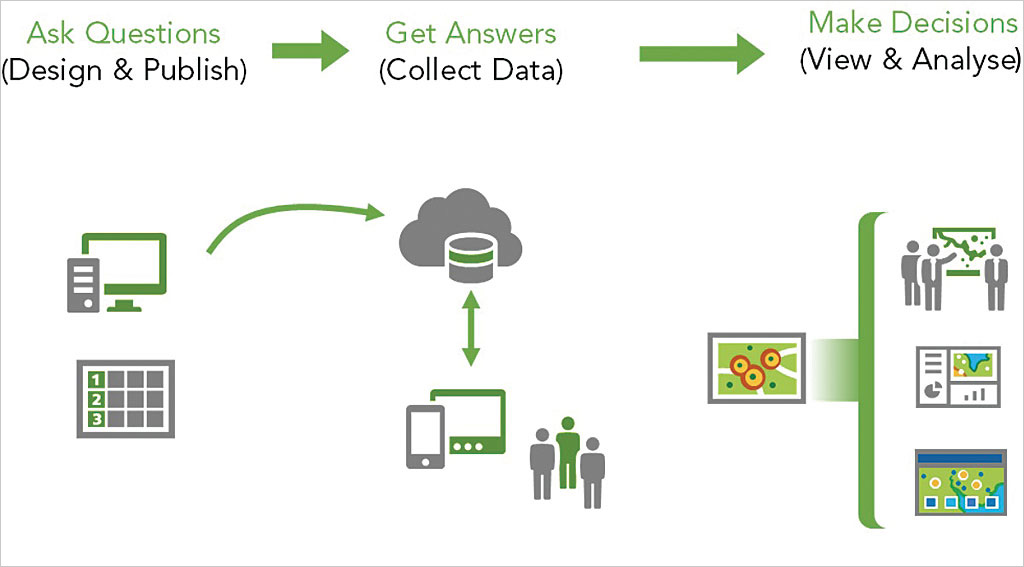
Survey123 for ArcGIS is a simple and intuitive formcentric field data gathering solution that makes creating, sharing, and analyzing surveys possible in three simple steps: ask questions, get answers, and make better decisions.
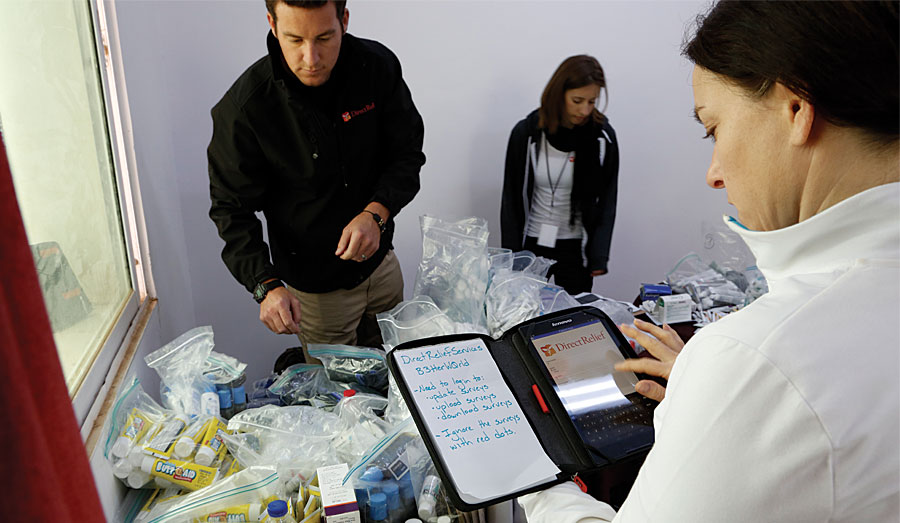
Instead of being mapcentric, Survey123 works with forms (or surveys), which are frequently used to collect information for many different disciplines. Surveys—from simple to sophisticated—are authored with Survey123 and then shared in ArcGIS. Using the Survey123 mobile app, teams in the field can capture survey results with their smartphones and tablets. Surveys can also be completed and submitted in a web browser.
Data captured is immediately available for analysis in ArcGIS to help you and your organization make better decisions. Survey123 is a versatile data collection solution already popular with users in public health, education, public works, resource management, disaster response, and humanitarian agencies.
1 It is easy to set up and use.
Getting started with Survey123 for ArcGIS is a simple 1-2-3 process (hence the name). It can be used by people who don’t have GIS expertise.
Step one: Ask questions
You can author and design surveys in one of two ways. For simple surveys, you can use the Survey123 website, which provides a user-friendly, drag-and-drop configuration user experience. For more sophisticated surveys, you can use Survey123 Connect, a desktop app that lets you author surveys using a spreadsheet program such as Microsoft Excel.
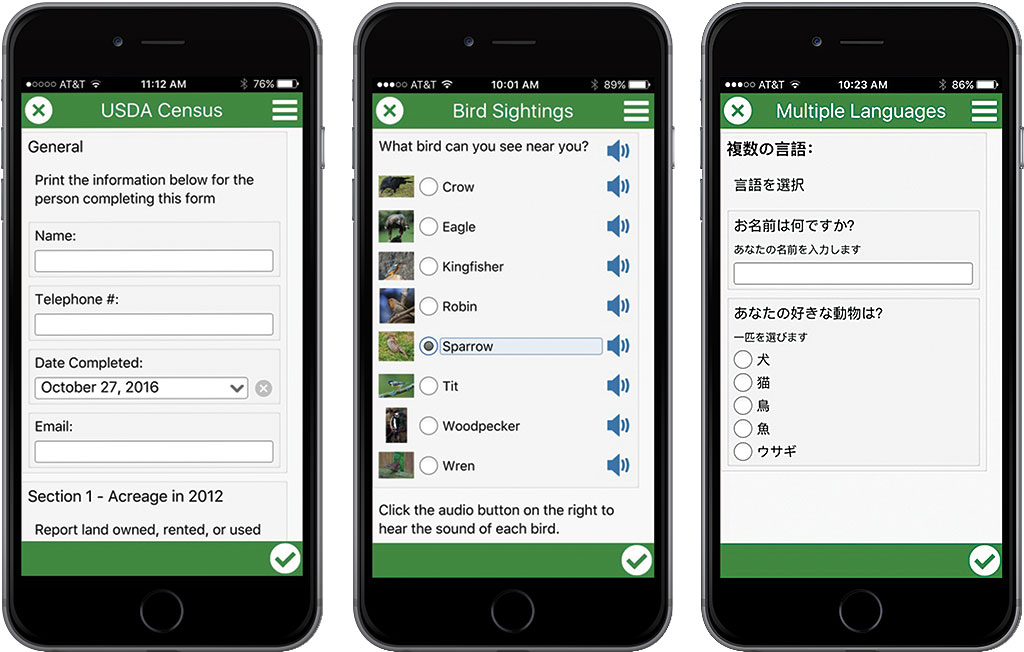
With Survey123, you create “smart” forms. These are survey documents have built-in logic that supports default values, skip logic, calculations, branching questions, and multiple languages. Surveys are then published to ArcGIS. You control who can access and work with your surveys. You can limit access to members of your ArcGIS organization or specific groups or share it with the public.
Step two: Get answers
Using the Survey123 mobile app, you can download surveys and start collectivng data in the field. The Survey123 mobile app is supported on iOS, Android, Windows, Mac OS X, and Ubuntu. It works on both smartphones and tablets as well as desktops. The mobile app was built using AppStudio for ArcGIS and takes advantage of the location-tracking capabilities found on mobile devices so you will know where the survey was submitted. Field crews can be deployed to gather data in both connected or disconnected environments. Surveys that are completed when crews are working in a disconnected environment can be submitted to ArcGIS when a network connection is reestablished.
Surveys authored in the Survey123 website can also be shared as a URL link, another useful option for collecting survey information. For example, you can email someone the survey URL link that they can click to open the survey in a web browser. Survey123 is a versatile solution that can support many different field data collection workflows.
Step three: Make good decisions
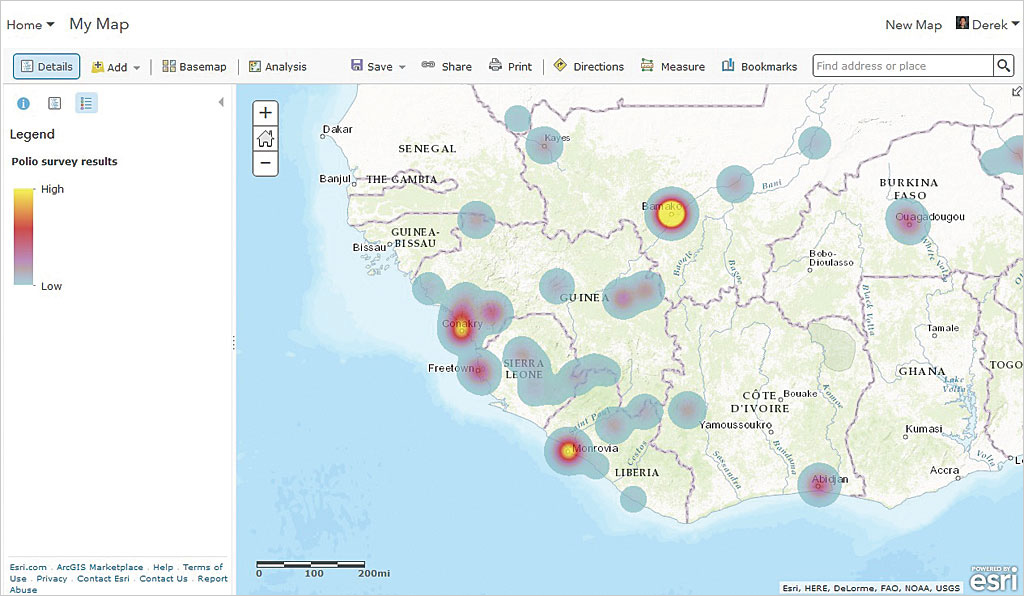
The data in surveys submitted to ArcGIS can be immediately accessed in the Survey123 website. The website includes reporting and mapping capabilities that can help you detect and identify trends and patterns in your survey data that can help you make better decisions for your organization.
2 Minimal training is needed for field crew users.
Having field crews gather data as correctly and as accurately as possible is one of the common challenges of field data collection. In some cases, the field crews performing the data collection operations may not be subject matter experts or technically savvy. They may be contractors or part-time workers. Field crews that use the Survey123 mobile app require minimal training because the product has been designed with simplicity in mind. In addition, completing forms is something that most people can do with absolutely no training. They simply sign in to the app with their ArcGIS account, select and open the desired survey, and start collecting data. The Survey123 mobile app user experience is form focused and meant for nontechnical end users.
3 It uses formcentric data collection with smart forms.
Survey123 for ArcGIS works with smart forms. A form is a document with questions and blank spaces for inserting the required information. A smart form contains logic and validation. For example, as a respondent answers questions in the form, additional questions may appear or some questions be removed in later sections, depending on responses to previous questions. A smart form only asks questions that are applicable to the respondent.
Survey123 forms support many types of data input in response to questions: date and time, numeric, text, prespecified choices, spatial location, images, audio files, bar codes, and signatures. More important, Survey123 supports logic and validation rules such as default values, calculations, cascading questions, grouping, relevant associations, and repeats. These options enable survey authors to create forms with sophisticated logic that will capture the appropriate information relevant to business needs. Survey123 adheres to the XLSForm open standard and provides options for customizing the look and feel of surveys with appearance and styling options that use HTML tags.
4 Survey123 is integrated with the ArcGIS platform.
Survey123 for ArcGIS is part of the ArcGIS platform. When Survey123 publishes a survey to ArcGIS, behind the scenes, a form item and a hosted feature service are created in ArcGIS Online or Portal for ArcGIS and secured with the same security model your organization uses. Collected survey data is stored as points in the hosted feature service. This hosted feature service works and behaves like any other hosted feature service and can work with the entire ArcGIS platform.
By clicking the Data tab on the Survey123 website and then clicking the Open ArcGIS Map Viewer button on the lower left corner, you can open a new web browser tab displaying your survey data in the ArcGIS Online Map Viewer. You can leverage smart mapping for cartography, the analysis tools, and all the functionality available in the ArcGIS Online Map Viewer with your survey data points. Because submitted surveys also include the spatial location where they were submitted, you can leverage the power of geography when working with your survey data.
In addition, you can save the displayed survey data as a web map so your survey data can be used in other ArcGIS client apps. The configurable application templates, Web AppBuilder for ArcGIS, Operations Dashboard for ArcGIS, Collector for ArcGIS, and Workforce for ArcGIS, can be potentially used by a larger audience to access your survey data and easily integrated to support other business workflows within the organization.
The Survey123 mobile app is also designed to be tightly integrated with other Esri mobile field apps such as Collector for ArcGIS and Workforce for ArcGIS. Using URL scheme functionality, a well-known protocol that lets apps communicate with each other, both Collector for ArcGIS and Workforce for ArcGIS can launch the Survey123 mobile app, open a survey, and prepopulate answers in the survey. This makes Survey123 part of a powerful and integrated mobile field solution.
The collected survey data can also be exported from ArcGIS to a comma-separated values (CSV) file, shapefile, or file geodatabase and used for other analysis purposes in ArcMap and ArcGIS Pro. Your collected survey data is immediately available without requiring additional data conversion.
5 It has built-in reporting capabilities.
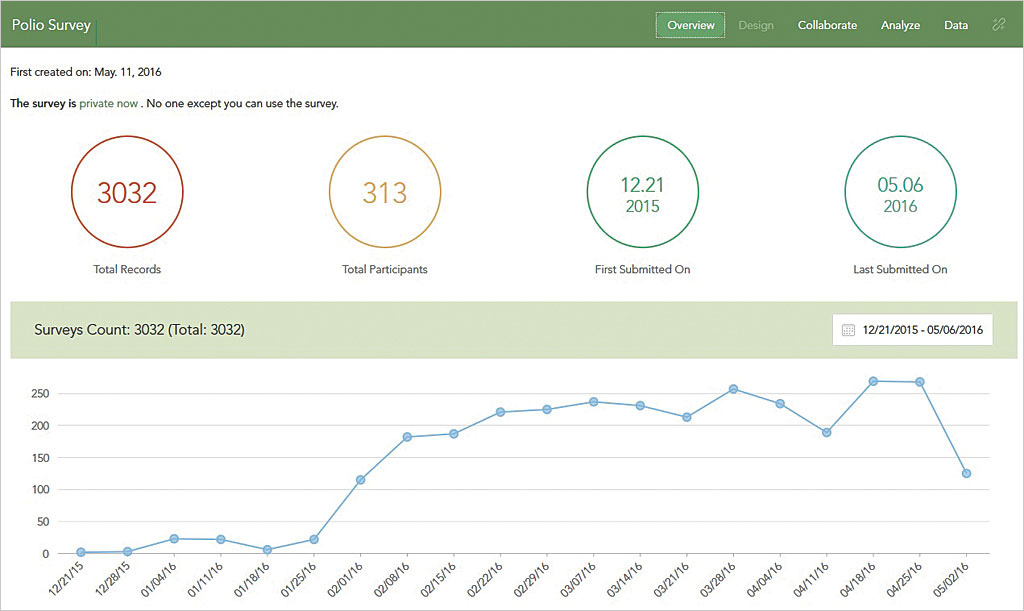
One of the key features of the Survey123 website is its great out-of-the-box reporting capabilities. Once surveys are submitted to ArcGIS, you can view a summary of your collected survey data on the Overview tab and look at basic stats such as the number of submitted surveys, number of unique survey participants, and first and last submitted surveys. You can also view data graphically to discover when and how frequently surveys were submitted over time and filter the reported stats based on the last 7 days, last 30 days, or a custom time period that you specify. Reporting is dynamically updated with each submitted survey to ArcGIS.
The Survey123 website also includes an Analysis tab that provides more detailed reporting on individual survey questions. For every survey question, summary and statistical information is presented. Reporting results will vary depending on the type of question. For numeric and choice questions, results will be shown as charts and tables. By default, a column chart will summarize the results, but you can switch to a bar or pie chart. You can also view the results on a map. For text questions, each unique text response is counted. For large volume text answers, a word cloud is generated that illustrates the frequency of common text responses. You can control which survey questions to include or exclude in the report, and you can print the report.

