Some GIS projects just benefit from having an outside perspective to ensure accuracy and increase efficiency. Esri partners are experts at implementing ArcGIS products and services to meet their clients’ needs. Find out how three Esri partners—Blue Raster, Dymaptic, and RAMTeCH—refined three organizations’ GIS implementations to make them more streamlined and user-friendly.
Evaluating the Carbon Benefits of Conservation Efforts
As the United States’ largest private conservation grant maker, the National Fish and Wildlife Foundation (NFWF) funds projects that sustain, restore, and enhance the nation’s fish, wildlife, plants, and habitats. Many of the conservation and restoration projects that NFWF supports also serve to offset greenhouse gas emissions that exacerbate climate change. The foundation uses an in-house carbon calculator tool to estimate and visualize the carbon impact of these projects.

NFWF developed the initial version of its carbon calculator using spreadsheets. This was limiting, however, because the calculator could only be used to analyze one county at a time. Evaluating projects that span counties—including those that affect large national parks or entire states—was a challenge because it required compiling values from multiple spreadsheets. To calculate carbon storage by land-cover characteristics, NFWF had to rely on county averages.
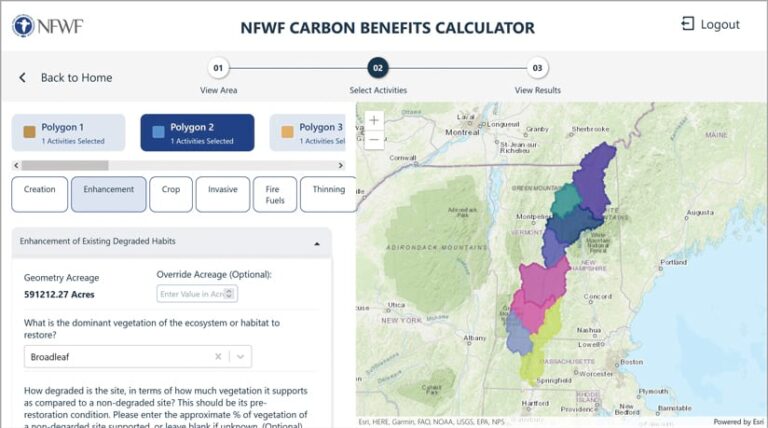
Seeking a simpler and more meaningful user experience, NFWF partnered with Blue Raster to develop the more robust NFWF Carbon Benefits Calculator. The team at Blue Raster understood NFWF’s need for a spatially explicit tool that would eliminate having to use hard-coded values and provide more precise calculations.
Blue Raster employed ArcGIS Enterprise, ArcGIS Image Server, ArcGIS Online, and ArcGIS API for JavaScript to design NFWF’s new Carbon Benefits Calculator as a web app. The tool applies Python logic and geoprocessing services to allow NFWF staff to upload polygons that represent the areas where specific activities have an impact. Using raster datasets, the calculator delivers multiple values within that area—including its climate, location, size, carbon stock, and land-cover characteristics—and automatically calculates the carbon benefits of the project based on the precise boundaries of where the activity occurs. The tool also allows users to save an analysis and mark it as authoritative, making it easier to find analyses that have already been completed.
With the new Carbon Benefits Calculator, staff members at NFWF can now make faster, easier, and more comparable estimates to measure the carbon benefits of conservation projects over a 30-year period.
Monitoring an Enterprise Deployment to Stay Ahead of Problems
The geospatial services team at Houston Public Works provides support for GIS operations while also maintaining the GIS IT infrastructure that underpins the daily operations of five business units that keep the fourth-largest city in the United States—Houston, Texas—running smoothly. The team relies on an enterprise portal and a separate system of GIS servers that includes a federated portal of three servers and regular map and feature services.

When Anthony Powell, GIS manager and current interim chief technology officer (CTO) for Houston Public Works, took over in 2015, the organization’s GIS was poorly structured and inefficient. Departments were saddled with slow save processes and unable to access relevant data. The data existed, but without a cohesive structure, everything was competing against one another. To meet this challenge, Powell eventually turned to GIS services provider Dymaptic.
The developers at Dymaptic are experts at implementing Esri technology, and they frequently use ArcGIS Monitor with clients to help them keep track of their enterprise systems and proactively address any issues. Dymaptic CEO Mara Stoica loves that, as part of the ArcGIS portfolio, Monitor remains compatible with all Esri updates and new products.
For Houston Public Works, the solution was to implement Monitor across the organization. Within a day of coming on board, Dymaptic’s developers were able to get Monitor up and running. They then gathered all the organization’s sprawling GIS infrastructure and configured it to capitalize on Monitor’s functionality, providing a live overview of the entire network of tools. The team also used the Monitor API to create customized alerts for Houston Public Works—homing in on only the critical alerts that Powell wanted to see—and added them directly to a Microsoft Teams channel.
The deployment of ArcGIS Monitor has resulted in improved performance across the organization’s ArcGIS implementations, a better user experience for ArcGIS software and GIS data users, enhanced troubleshooting, and a fourfold increase in GIS usage at Houston Public Works. Being able to see what’s happening, in detail, across the whole database server—including performance statistics, server and database statuses, and activities—has allowed the geospatial services team to get ahead of problems. This has led to a marked decrease in tickets submitted to the team for support, despite the increase in GIS usage. The result is an improved system with faster performance and fewer hiccups.
Streamlining Mobile Data Collection to Mitigate Risk
Peoples Gas, the largest natural gas distribution company in Pennsylvania, serves approximately 740,000 customers. In 2015, the Pipeline and Hazardous Materials Safety Administration (PHMSA) proposed an amendment to its regulations to address safety concerns with plastic piping. To comply with the new requirements, Peoples started looking for a solution that could track and trace assets and their materials. The goal of the solution was to mitigate system risk, increase efficiency for field- and office-based operations, and enhance public safety by improving how assets are identified and located and making it easier to track down and report defective materials.

Through a competitive bid process, Peoples selected RAMTeCH to support this critical initiative. Using ArcGIS Enterprise and an app built with ArcGIS Runtime SDK for .NET, the RAMTeCH team implemented a proven tracking and traceability solution that allowed staff members at Peoples to maximize their existing investment in Esri technology.
The solution automates the process of capturing location, material, and manufacturer information for new gas assets when they’re installed. Mobile workers use barcode scanners and high-accuracy GPS receivers to record the data. The scanners record attribute information from barcodes on the assets, following the ASTM International F2897 Tracking and Traceability standard. And the GPS receivers capture the installed locations of distribution pipes, fittings, valves, and more—as required by the proposed PHMSA amendment. This information feeds into the iOS app that RAMTeCH built, which mobile workers use on Apple iPads. This ensures that the data gets represented in the company’s GIS as features.
Since implementing the solution, Peoples has reduced the need for paper records in the field, which has streamlined both mobile and office-based workflows. This digital data collection process has eased mapping backlogs at Peoples, since field-based data collection now seamlessly integrates with the organization’s enterprise GIS. The solution has also improved the use of GIS for identifying and locating pipeline components, as well as any defective materials, reducing the risks associated with gas distribution operations and improving public safety.

