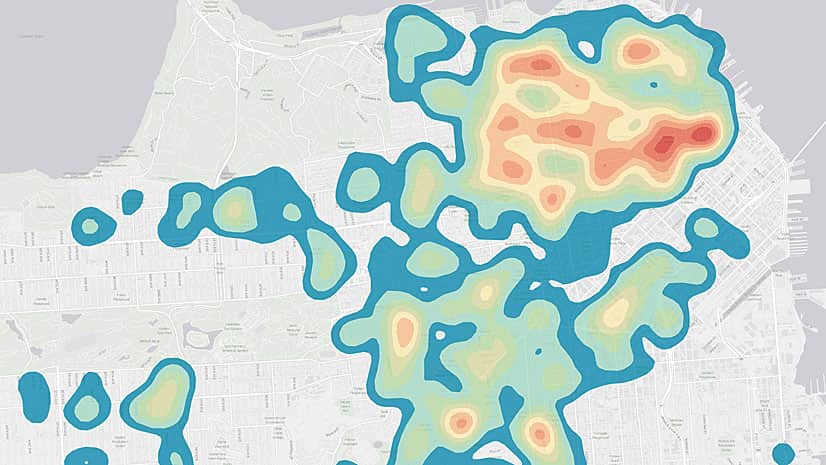
The April update to ArcGIS Online brings users more demographic data; an easier way to find maps, scenes, and layers; a new configurable app template; added flexibility in how they update data; and improved 3D experiences. Read on to learn more.
Additional Demographic Data
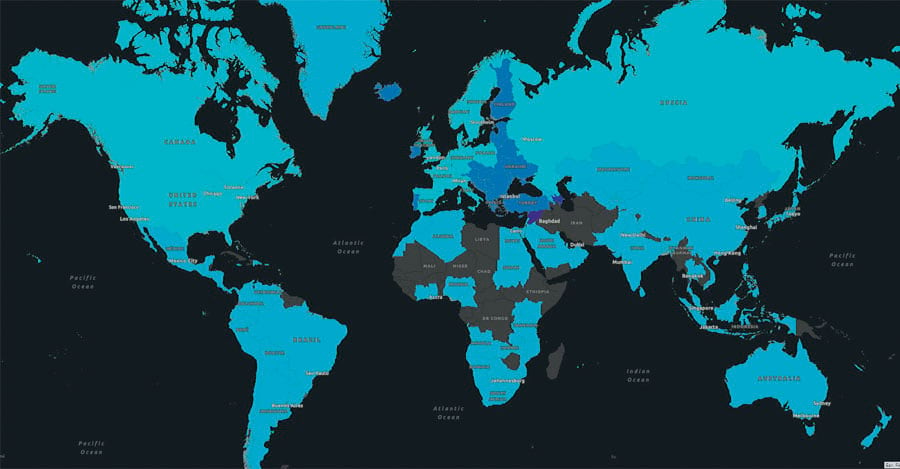
In the April release, Esri updated the demographic data for 50 countries, which users can access—along with all the other available demographic data—using ArcGIS GeoEnrichment Service; a variety of ready-to-use layers in ArcGIS Living Atlas of the World; and several apps, including ArcGIS Business Analyst and ArcGIS Maps for Office.
The most notable updates came from Japan and Germany. Demographic data available in ArcGIS Online now includes information from the most recent census in Japan, along with many popular variables such as population density, one-person households, and the population attending or graduated from school. For Germany, the data now includes four additional population attributes—male population, female population, deaths, and births—that span the national to the neighborhood level.
Content Categories Improve Search Results
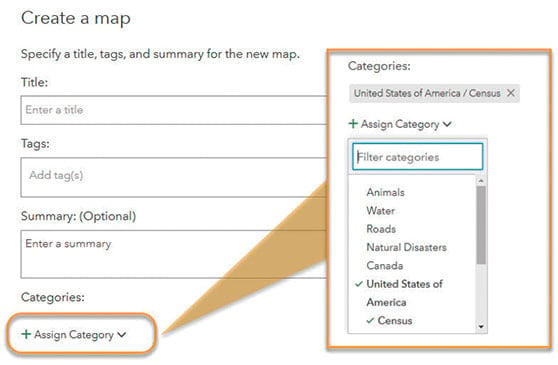
Users can now make their maps, scenes, and layers easier to find by assigning them categories. Administrators and group owners set up the categories and customize them to match the work their organizations do, and then users can employ them. Not only do content categories help users find items when searching through an organization or group’s content, but they also allow users to quickly make sense of a lengthy list of search results.
A New Map for News Articles and Blogs
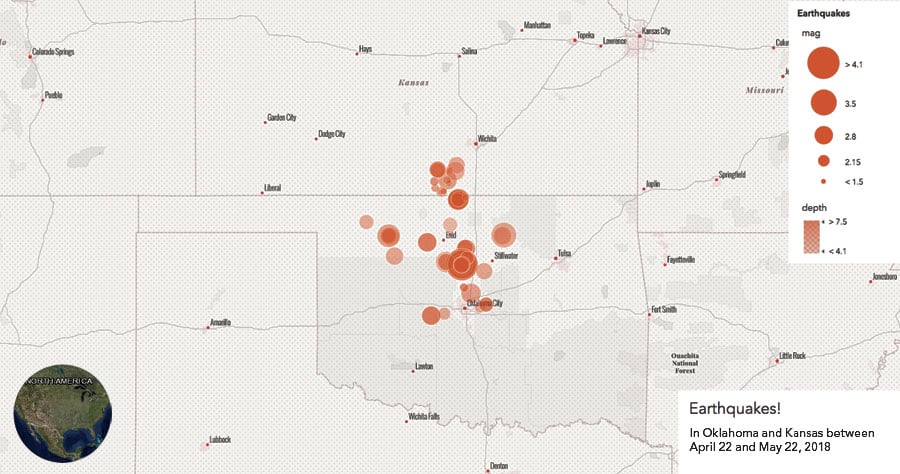
There’s a new configurable app template that provides a crisp and simple way to share interactive maps online. Media Map fits perfectly into small spaces on web pages and performs well on mobile devices, making it a great visual aid that can be neatly embedded into news articles and blogs. A splash screen and an information panel introduce the map. To keep viewers within the relevant portion of the map, users set the minimum and maximum zoom levels and lock the extent to which the map can be scrolled. Bookmarks provide shortcuts to interesting places. And a unique circle inset shows an overview map, helping viewers grasp the bigger-picture perspective.
New Ways to Update Hosted Feature Layers
Users now have more flexibility in how they update their data.
In hosted feature layers, they can apply a new data setting called unique constraints to prevent duplicate entries in fields. When toggled on, this setting ensures that unique values are entered for fields such as parcel ID or customer number. It also helps enforce data integrity by making specific fields the match field, or key, when updating existing data.
Additionally, the ArcGIS Online append functionality, which enables users to update data in their hosted feature layers, now supports two additional file formats—Microsoft Excel and GeoJSON. Being able to use an Excel spreadsheet as the input eliminates the need to export it as a CSV file. And having the capacity to append data in GeoJSON files is advantageous for users who favor more open formats.
An Elevated 3D Experience
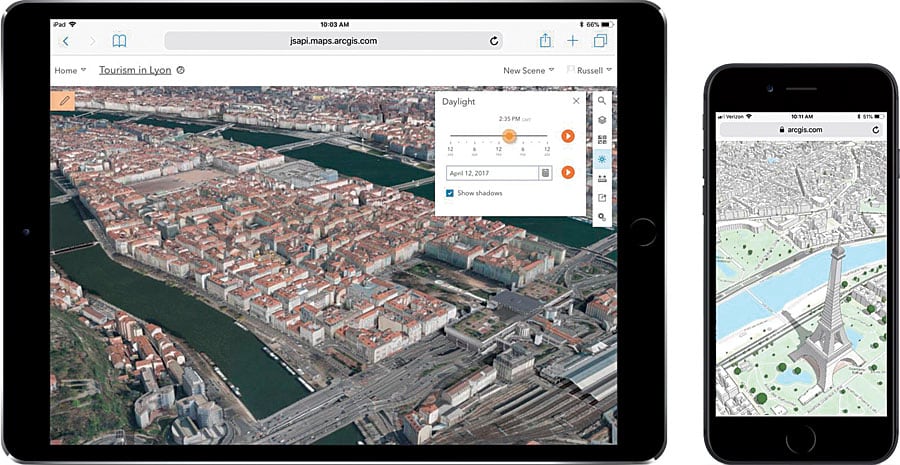
Esri has enhanced the 3D experience in ArcGIS Online considerably with full mobile support, edge rendering, and added functionality in the Measure tool.
For starters, viewing 3D scenes is no longer limited to desktop browsers! Now, users can explore 3D scenes on modern smartphones and tablets. Scenes are easy to navigate using touch gestures to zoom, pan, rotate, and tilt.
Edge rendering is new, too. It adds outlines to building shapes to make 3D scenes really pop. Switching on the Edges toggle within the Configure Layer panel automatically draws the edges onto all the buildings in a 3D scene, improving depth perception and making it easier for viewers to clearly see feature details.
Additionally, while still allowing users to make point-to-point measurements that interactively calculate distance and height, the Measure tool now also supports area measurements. The tool can be used to calculate ground areas and perimeters as well as vertical walls and roofs. Users can easily modify their measurements by clicking or tapping any point in the measurement and dragging it to a new position. The calculated area then automatically updates.
