ArcGIS Online credits are essentially a form of currency. They are used to “purchase” specific cloud-based services.
Organizations consume credits when they employ certain services to complete a project or as part of their recurring workflows. A few common ways that credits get consumed are through performing geocoding, conducting spatial analysis, and doing data enrichment.
To get a better understanding of how easy and inexpensive it can be to use credits in ArcGIS Online to create maps and communicate data to stakeholders, check out the following sample workflow:
The Situation
A local fire department recently expressed interest in gaining access to grant money offered by the state to increase countermeasures aimed at preventing traffic accidents. These countermeasures include installing speed safety cameras, enhancing the visibility of crosswalks, and building meridian barriers.

To qualify for the grant money, the organization had to provide compelling data to support where specific countermeasures would be most effective on local public roadways. The fire department needed to identify where most of the accidents in its jurisdiction occur. Members of the fire department partnered with staff at the local Department of Transportation (DOT) to do the research and present their findings in a compelling way.
The fire department’s ArcGIS Online administrator gave the team a budget of 100 credits for this project, which took about two months to put together, present, and hear back on. Here’s what they were able to do.
Geocoding = 38 Credits + 0.48 Credits for Storage
The fire department started by pulling data from its dispatching system on the addresses of past 911 calls related to traffic accidents. The team members gathered accident report records from the previous year and compiled that data into a spreadsheet based on the addresses. The total number of reported incidents equaled 950.
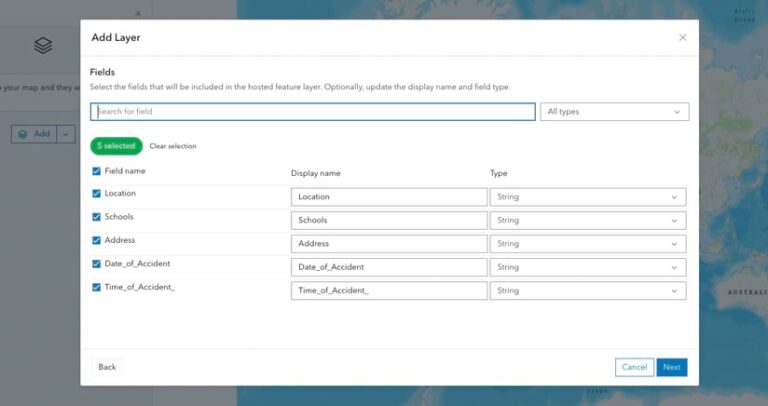
Using ArcGIS Online, the GIS analyst assigned to the project dragged the CSV file into Map Viewer and created a hosted feature layer. The analyst then geocoded the data, converting the list of addresses to points in a feature service. The point locations were displayed on a street map and visualized by when the accidents took place.
Geocoding can be done using addresses or specific coordinates, and once this data is entered in Map Viewer, the software displays specific locations as points on a map. This is also the first step in turning data from a file into spatial data. It consumes 40 credits per 1,000 geocodes.
The fire department’s resultant hosted feature layer stored 1,000 geocodes, which took up approximately 1 MB of storage space. Storing a hosted feature layer consumes 2.4 ArcGIS Online credits per month for every 10 MB stored, making the total storage charge 0.48 credits for two months.
The fire department needed to do all this to analyze previous traffic accidents and understand if there were any commonalities or trends in those incidents, such as where they happened (near schools, perhaps) and what time of day more accidents occurred (during school drop-off and pickup hours, for example).
Publishing a Roads and Schools Layer = 26 Credits
Once the fire department team members had their geocoded data on traffic accidents, they presented their findings to the local DOT. The DOT’s GIS analyst shared a file geodatabase with the fire department that showed schools and roadways in the area. This was used to create a map that displayed the traffic accident points overlaid on the schools and roads layer.
The GIS analyst from the fire department published the file geodatabase as a hosted feature layer and then added it to Map Viewer. The published hosted feature layer was 54 MB, which consumed approximately 13 credits per month for two months.

Analysis = 1 Credit + 0.48 Credits for Storage
The fire department’s GIS analyst then used the Summarize Nearby tool in ArcGIS Online to find traffic accidents that happened near schools. By running an analysis on the schools and the traffic accidents layer, the team determined which accidents occurred within one mile of a school.
Employing the Summarize Nearby tool consumed 1 credit per 1,000 features. The fire department’s jurisdiction contained 50 schools, and 950 total accidents occurred throughout the previous year. The GIS analyst published the results as a hosted feature layer that was 1 MB. This consumed 0.48 credits over two months.
Communication = 0 Credits
Once the analysis was complete, the fire department’s public information team leveraged the resultant map and data to create visual assets. Working with the fire department’s GIS analyst, the public information team used ArcGIS Dashboards to build a public-facing, interactive dashboard that could be submitted with the organization’s grant application.
With its easy-to-understand visuals, the dashboard showed state grant makers where the majority of traffic accidents took place and what countermeasures were needed in those areas. GIS allowed the fire department to take data collected from 911 calls, plus the locations of schools, to prioritize where countermeasures should be installed. Ultimately, this would improve residents’ quality of life.
Total = 65.96 Credits
Taking the geocoding, hosting, publishing, and analysis functionalities included in ArcGIS Online, the fire department was able to show—using just 65.96 credits—which countermeasures would be helpful in areas where traffic collisions occur most frequently. In addition, the team was able to use a data-driven narrative to communicate the significance of the fire department’s application and clearly articulate the value of GIS for such a project.
The state awarded the team the grant money, and the fire department was able to use it to improve key roadways and pedestrian amenities in its jurisdiction. Overall, the project received positive feedback from community members, and the organization will continue to use ArcGIS Online to make decisions and assist with future capital improvement initiatives.
Use Only What’s Needed
This example is one of many that shows how using ArcGIS Online credits can produce reliable analytics and communicate data quickly to both internal and external stakeholders. Whether you need to visualize important data, prepare for a capital improvement project, or simply store data, ArcGIS Online credits allow your organization to pay only for the specific capabilities it needs. What’s more, all these functionalities can be performed in the cloud, so no need to manage your own infrastructure.
If you have purchased an ArcGIS Online subscription and have questions about your organization’s credit consumption, reach out to your account manager. For more general information about credits, visit the credits overview page.

