Washington, DC, mayor Muriel Bowser adopted the Vision Zero initiative in 2015 to transform transportation safety and work toward the goal of having zero traffic-related fatalities or serious injuries on the city’s streets. The program is founded on developing data-driven approaches to street design, operations, and maintenance; increasing targeted education campaigns about why traffic injuries and fatalities happen; boosting targeted enforcement of traffic laws; and improving post-crash care.
In 2022, Bowser and her team updated Washington, DC’s Vision Zero initiative to ensure that it prioritizes policies and projects that promote greater equity in decision-making. The revised strategy seeks to provide the most extensive benefits to neighborhoods with streets that have experienced historic disinvestment and contain high numbers of vulnerable populations, such as people who walk or use mobility devices.
This program modernization effort included building a new Vision Zero DC website. Working with Esri partner SymGEO, a Maryland-based GIS company specializing in ArcGIS Hub, ArcGIS Online, and state and local government solutions, the Vision Zero team at the District Department of Transportation (DDOT) used ArcGIS Hub to create a consolidated home for information on current and upcoming traffic safety projects. The site includes dashboards and maps that provide an interactive user experience and display information, such as detailed crash and road improvement project statics and crash locations, overlaid on demographic data. The hub site also serves as a robust educational tool for promoting safe traveling behaviors.
“The new Vision Zero DC website will help us work closely with community members to identify problems and build solutions,” said DDOT Vision Zero director Linda Bailey. “SymGEO iterated quickly and efficiently on design ideas and built a very engaging platform solution for DDOT.”
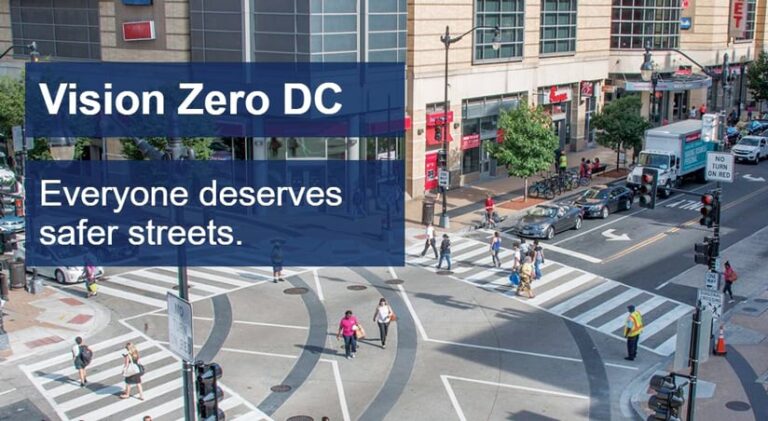
A New Focus on Equity in Traffic Safety
Bowser’s 2015 Vision Zero initiative started as an all-hands-on-deck approach to traffic safety, with DDOT working closely with community members to identify problems, build solutions, and design streets that are safe for everyone. Since the initiative’s inception, more than a dozen of Washington, DC’s most dangerous corridors have been made safer by reducing conflicts at 15 high-crash intersections and along segments of major corridors. Safety has also increased in school zones by significantly expanding the District’s school crossing guard program.
DDOT’s Vision Zero 2022 Update focuses on achieving equity in traffic safety and taking a holistic approach to making Washington, DC’s transportation system safer.
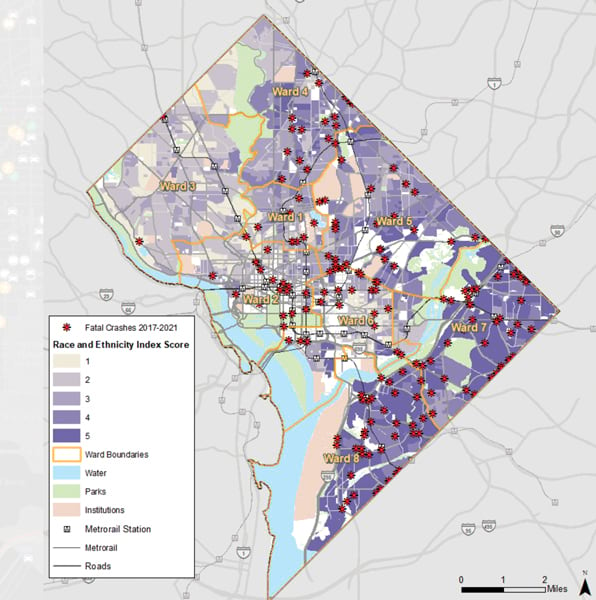
“We know our efforts must ever evolve by applying lessons learned and data-driven solutions, especially to our most vulnerable street users and populations,” said DDOT director Everett Lott. “We also know the burden of traffic violence falls disproportionately across DC, with Wards 7 and 8 hit hardest—and that’s why we remain so keenly focused on equity.”
The plan fosters collaboration among 30 District agencies, with 5 key agencies deeply involved and the Metropolitan Police Department playing an integral role. It also adopts the national Safe Systems approach, which is based on how an entire interconnected transportation system can become a safer environment for everyone by understanding that humans make mistakes and that human bodies are vulnerable to crash forces. The Safe Systems approach centers on five key elements: safe people, safe streets, safe vehicles, safe speeds, and post-crash care. All these components of Washington, DC’s Vision Zero plan are featured prominently on the new hub site.
A Well-Organized, Audience-centric Data Hub
The Vision Zero DC site is organized into easily navigable tabs and subsections based on audience interest. It is also mobile responsive and designed to be broadly accessible.
On the home page, site visitors can learn what Vision Zero is, get tips for safe driving, hear from crash victims, and find out what to do after a traffic crash occurs. The Overview tab contains information on the Safe Systems approach, reports on progress toward reaching the goal of zero traffic crash fatalities, and infographics that show traffic- and crash-related statistics. The 2022 Update tab presents a wealth of information about how the Vision Zero initiative has progressed since 2015, what goals the mayor’s office will be pursuing over the coming years, and how the city is going to act on those plans.
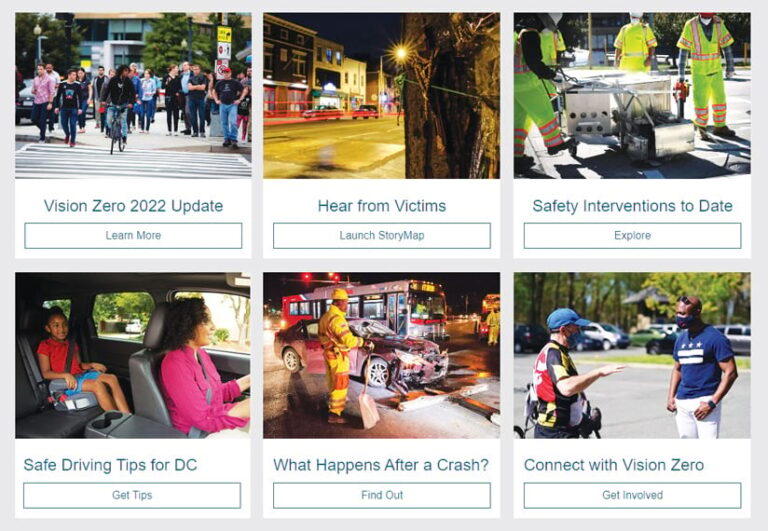
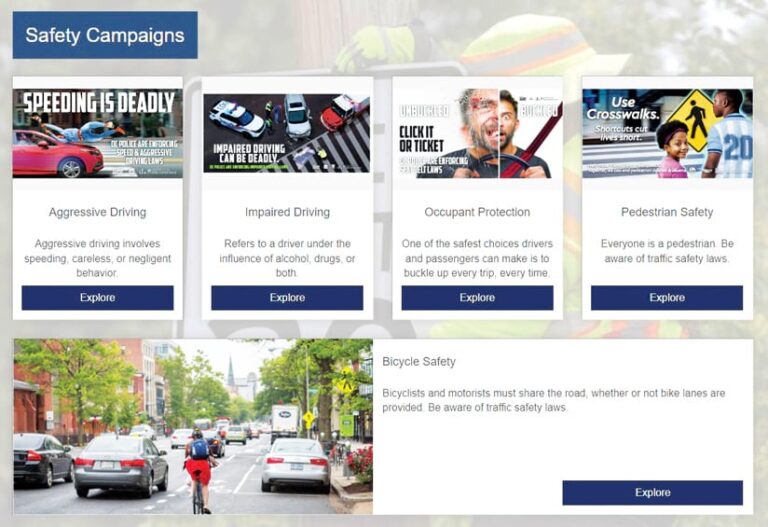
The Education tab features educational campaigns that promote safe driving and good pedestrian habits throughout Washington, DC. Via ArcGIS StoryMaps narratives that contain videos, charts, and graphs, this section gives site visitors a poignant look into the human costs of dangerous driving and unsafe behaviors. The Safety Campaigns section gives visitors detailed overviews of the biggest threats to pedestrians, cyclists, and other vulnerable travelers on Washington, DC’s roadways—such as aggressive and impaired driving—through statistics and an overview of related laws and penalties.
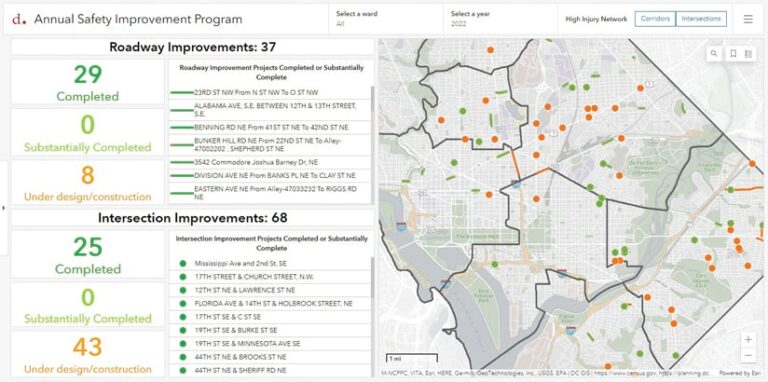
Looking at the Engineering tab, visitors can see the significant progress that DDOT and the city have made in designing solutions to benefit both vehicular and pedestrian traffic. Part of this is organized in the Safety Treatment Toolbox, which has expandable sections that show the various tools the city is using to protect walkers and bikers, improve visibility, reduce turn conflicts, and much more. The Annual Safety Improvement Program dashboard, located below the toolbox, shows—via tables and a map—the roadway and intersection improvements that have been made throughout the city. Additionally, the DDOT Safety Intervention Dashboard gives site visitors a visual and interactive map-based view of where DDOT has implemented tools that improve safety, such as bike lanes, new stop signs, and dedicated bus lanes.
The Crash Analysis tab allows people to take a deep dive into the data that’s fueling the city’s push for zero fatalities on Washington, DC’s roadways. A dashboard, organized in an ArcGIS StoryMaps story, shows details on traffic crashes and fatalities and lets users filter the map- and chart-based data by mode of transportation and injury severity. This tab also includes information on what to do after a crash, comparisons of crash data with other major American cities, and crash statistics juxtaposed with demographic data.
Two additional tabs on the site—the Safety Grants tab and the Get Involved tab—give visitors details on safety programs, grants, and helpful publications put out by the DDOT’s Highway Safety Office. These sections also encourage site visitors to stay connected to and up-to-date with the city’s Vision Zero initiative via social media and by getting involved with other organizations working toward similar goals.

