When a historic windstorm swept through eastern Washington and northern Idaho on November 17, 2015, the local utility company, Avista Utilities, expanded its use of the ArcGIS platform to give mobile workers the tools they needed to quickly assess the utility’s infrastructure. By extending its existing GIS technology—using Collector for ArcGIS, Survey123 for ArcGIS, and Operations Dashboard for ArcGIS—the utility gained the ability to share information from its system of record throughout the company, as well as with contractors who were assisting with the restoration effort.
This prompted Avista to further augment its use of GIS for damage assessments, incorporating ArcGIS Online more extensively and building in other field apps. The utility underwent a significant digital transformation.
The Calm Before the Storm
Prior to the windstorm, damage assessments at Avista revolved around a spreadsheet. Although this tabular record was packed with information—more than 50 fields—it took the utility a lot of time to get a complete picture of the damage to its infrastructure. This made it difficult for Avista’s decision-makers to assess and prioritize work, rapidly deploy field crews, and share information.
During a meeting geared toward improving the damage assessment process, Allen Cousins, a senior GIS analyst at Avista, was pulled in to see if GIS could help. Cousins was candid about the inherent problems of spreadsheet-based inventories and suggested a more effective path forward. By configuring Collector, Survey123, and Operations Dashboard, he said, Avista would be able to get damage assessment data into its existing GIS much faster, where it could help decision-makers prioritize recovery work.
“There was a better way to record and share information using mobile apps that would feed [into] a digital dashboard [to provide] an overview of inventory,” said Cousins.
Assessing Damage and New Opportunities
The 2015 windstorm caused the largest outage event in Avista’s history. About half its customers—approximately 180,000 people—were without power, and the utility’s infrastructure sustained significant damage.
Initially, the company attempted to collect information about its damaged infrastructure using the old spreadsheet method. But it quickly became apparent that this was woefully inadequate.
Cousins and his team prepared a Collector app to use for post-storm damage reassessments. Within three days, they’d configured and deployed the app to nearly 70 users, who reassessed Avista’s infrastructure over the next six weeks. The assessors captured all windstorm damage and made sure that the repair work done by outside crews and contractors met company construction standards.
Impressed by how easy it was to configure and use mobile GIS apps, Avista opted to modernize its damage assessment plan to fully incorporate mobile GIS alongside Esri’s desktop apps and ArcGIS Online. Because ArcGIS Online could be tethered to the utility’s databases, it became the center of Avista’s damage assessment process.
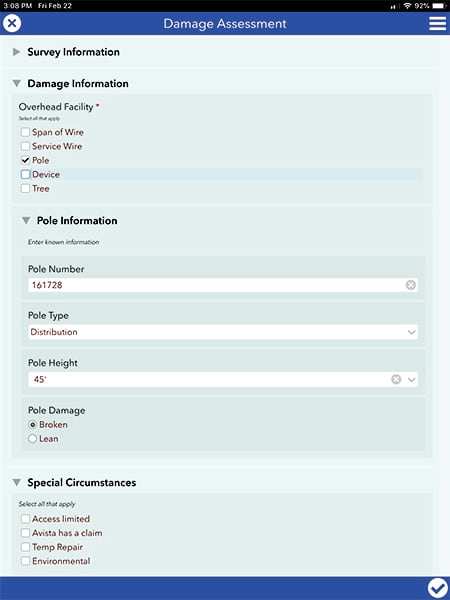
The new GIS-centric process would allow damage assessors to collect the least amount of data required to estimate the major materials and time needed to make repairs. Now, instead of having to identify all the construction components of a broken pole, an assessor would just have to note that a pole was broken, and Avista would leverage the facility data already stored in its GIS to determine the necessary materials. Additionally, damage assessors would no longer have to fill out location information for each asset, since the GIS-based mobile apps could automatically apply this data to each damage assessment.
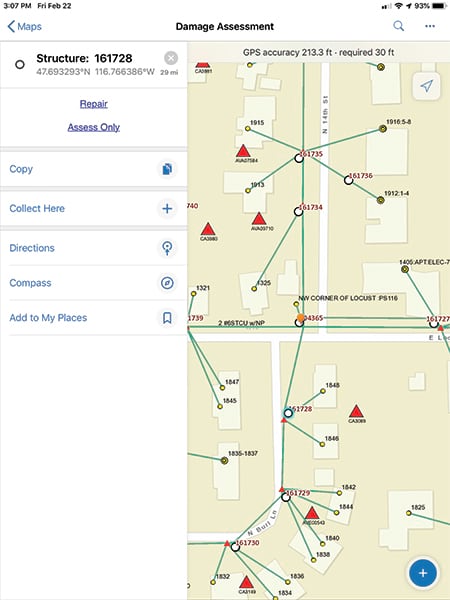
Using an app on their iPhones or iPads, damage assessors who visit outage areas now select a specific damaged facility on a map in Collector and fill out a survey—complete with photographs of the damage—with Survey123.
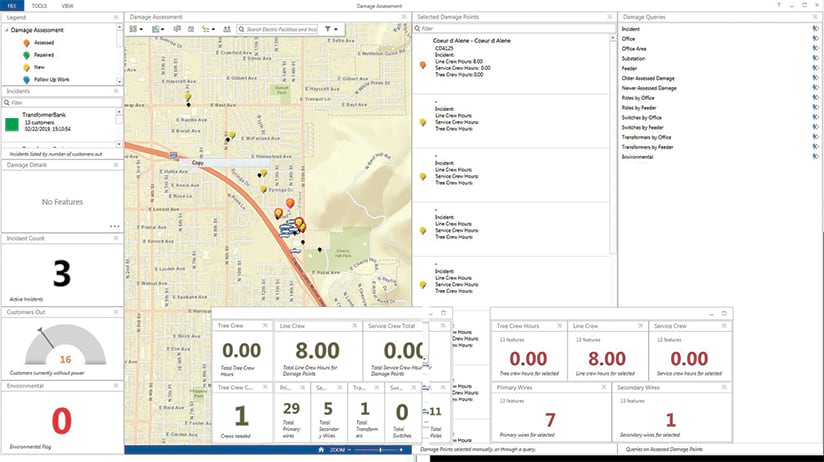
“With this new system, crews are able to record and update, in real time, the details of damage to Avista’s infrastructure,” said Cousins. “While other field assessors and crews see these changes on their mobile app, decision-makers in the office see this information in an executive dashboard based on Operations Dashboard.”
Ready for the Next One
Avista’s new damage assessment solution consists of a suite of interrelated apps that each play a role in the outage management chain.
Identify Damage, based on Collector, is similar to the prototype that was configured following the 2015 windstorm. This is the entry point for Avista’s damage assessment solution. Users tasked with collecting damage data start here by identifying the facility and marking it as Repair or Assess Only. The app then executes the appropriate Survey123 survey.
Assess Damage, based on Survey123, is a simple form that crews use to gather assessment details. The selected data about each facility is passed from Collector to Survey123 so the user doesn’t have to reenter known attribute data.
The View Outages app, based on Explorer for ArcGIS, allows users to see Avista facilities in the field alongside information about existing electrical outages. Users can click on most of the facilities and view attribute data or even select a customer to call from within the app.
The Damage Assessment Overview, based on Operations Dashboard, presents all the data collected in the field to Avista decision-makers so they can act on it.
With its new suite of apps, Avista is ready to respond to the next storm that threatens its electric grid.
