With its famed wine country and rare Mediterranean climate, California’s Napa County is one of the most biologically diverse counties in the San Francisco Bay Area. The climate, topography, and soil provide an environment that’s suitable for growing crops such as grains, nuts, and grapes, as well as for supporting livestock. A recent Napa County crop report showed that the county’s agriculture production had a gross value of more than $894 million in 2022, a 19.9 percent increase from 2021.
To promote and protect this valuable industry, the Napa County Agricultural Commissioner’s Office implements a variety of federal, state, and local regulatory programs. It’s a big job. The Agricultural Commissioner’s Office regularly surveys more than 46,000 production acres, works with more than 700 local growers, and monitors thousands of properties.
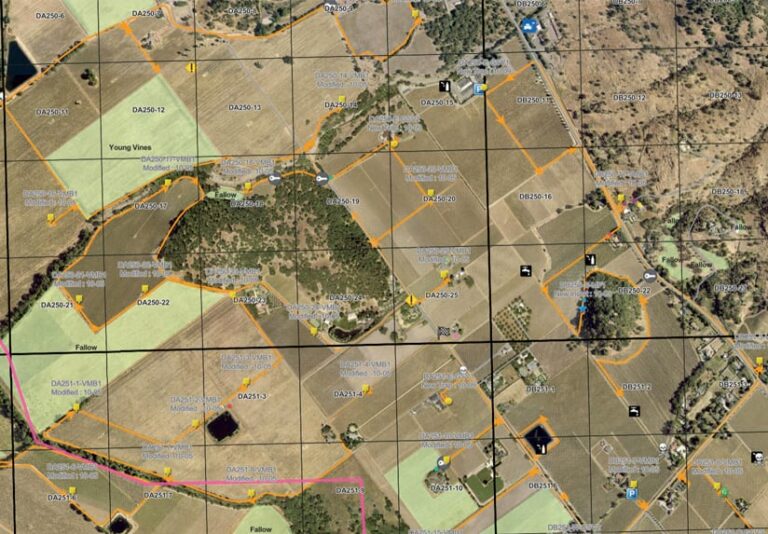
One of the programs to support this effort is pest detection. The county’s pest-detection program helps prevent the spread of exotic pests in commercial agriculture by catching the pests in detection traps and identifying them early—before they become established.
For years, this process was slow and cumbersome. Paper-based records were kept in different systems, and there was often overlap in work. To streamline workflows and improve data integrity, the commissioner’s office has implemented ArcGIS Field Maps to collect data and report on pest-detection results.
Replacing an Inefficient System
Mobile crews, or “trappers,” are a critical part of this program. Until recently, these crews, who place and maintain pest traps, would manually complete a map card with details—by drawing the location of what they were inspecting (such as a tree), documenting GPS coordinates, and placing traps to catch invasive pests. Each trapper would then put the map cards in a binder. According to Anna Norton, Napa County deputy agricultural commissioner and sealer of weights and measures, having the crew working with these individual paper records led to a costly lack of efficiency, as trappers would spend hours on record-keeping every day.
This manual process extended to daily trap summaries, which each trapper is required to complete. The summaries included a handwritten record of every trap serviced. Staff would also use field data to conduct preseason planning and complete mandatory federal reports, requiring the transfer of the handwritten data to other forms and increasing the likelihood of data transfer errors.
In addition, due to inefficient route-planning, multiple employees would often service the same property for different traps. “We’d have one project in one type of binder and another project in another type of binder,” Norton said. “There was no way to integrate and overlap those projects without having some sort of electronic tool where everybody could see live what traps were in action.”
Slowing this system even further, every year hand-drawn maps would have to be re-created and updated for new pest-monitoring locations and changed priorities. And when a dangerous pest was found for the first time, the discovery would trigger strict regulatory and auditing requirements that held up commercial shipping.
Because of changes to priorities and conditions every year, Norton said, “we would have multiple full-time staff going through all of those binders of trap cards, hand-drawing all of the updated maps to then plan where our traps were going to go for the next season.”
To streamline these processes, the Agricultural Commissioner’s Office turned to Esri technology for an all-in-one mobile data collection and reporting system. The new solution has improved field data collection processes and electronic reporting and helped protect local agriculture more efficiently.
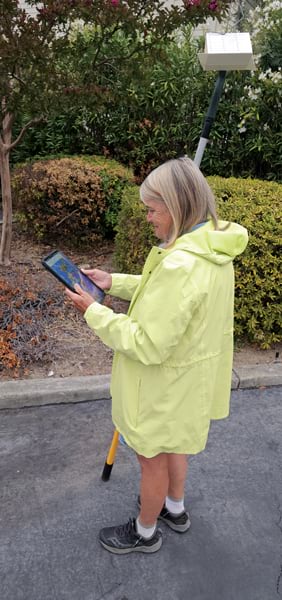
Staff initially tested ArcGIS Field Maps by having a trapper use it in the field for one season and report results. The trapper’s feedback was excellent, and the office transitioned full-time to Field Maps in 2020. Norton and her team also developed in-person annual Field Maps training, how-to videos, presentation slides, and offline documentation that trappers can access in the field.
At the beginning of each season, a week is dedicated to hands-on training, including presentations on the revamped process. Each trapper has an Apple iPad with Field Maps installed. The second week is set aside for field training, which usually takes only two days because of how easy and intuitive Field Maps is, Norton said.
The Benefits of a Digital Transformation
Field Maps has helped reduce work time and increase data accuracy while enhancing staff collaboration and work satisfaction. For example, the preseason planning process, which used to require four staff members to work nearly full-time on it from October through February, now takes two people a week or less. As a result, annual time and labor costs for this process fell from $106,000 to about $5,000.
This system is also more accurate, as is the distribution of daily work for staff. Much of the data is now prepopulated in digital smart forms rather than hand-written every day on trap cards, so there are fewer fields to complete—and fewer errors. Trappers can use voice dictation on their iPads to record their observations, and it’s easier for them to find their route assignments. And instead of data entry that “would have been a nightmare,” according to Norton, “now you drop a beautiful little point on the map and move on.” The office’s error rate is now less than 1 percent, she added.
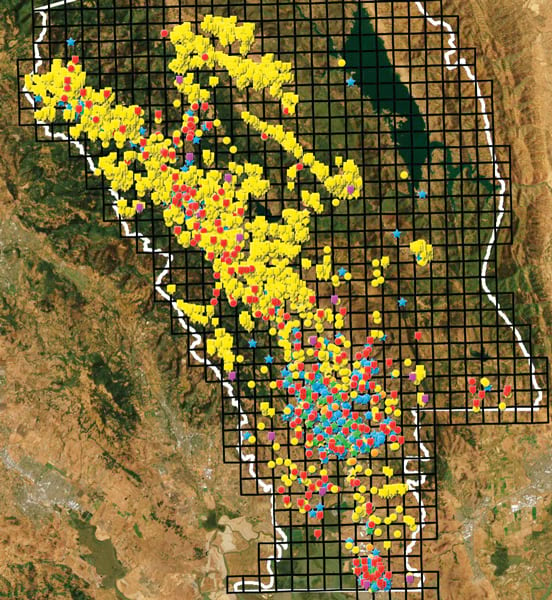
While trappers are placing or maintaining the invasive-species traps, they now have access to all available trap history in one mobile app. This enables them to know who has serviced it and when and—more importantly—what they need to do next. They also use a function in Field Maps called Markup to share the areas that have been covered or are outstanding, as well as the routes they take from trap to trap.
“Even just simply sharing and covering routes was almost impossible on paper. [Now] everybody knows exactly where everybody is at any given time,” explained Norton. “And because of the symbology, it’s super easy for other staff to then jump into other people’s routes.”
Improved reporting should also help in instances of quarantine. If a dangerous pest is found in the county, there are strict regulatory requirements to follow to ensure that it doesn’t spread. Data must be readily accessible by federal and state agencies so that they know how the dangerous pest is being eradicated. According to Norton, auditors previously had to be in the Napa office and spend days looking through trap books for data.
“Our international partners aren’t going to let us continue to ship anything until we prove, through this laundry list of scientific methods, that we have executed everything perfectly and sent them that data in an auditable fashion,” explains Norton.
With all these changes, Norton said that mobile crews are happier workers.
“Our data tracking is so much cleaner with Field Maps,” she said. “Our trappers love how much easier the workflow is, and it’s easier for them to manage their work.”
As for the office staff, the data is right at their fingertips. “Everybody knows exactly where everybody is at any given time,” Norton said. “And we can put reports together in a matter of hours, which is incredible.”
Developing Field Maps solutions for the Agricultural Commissioner’s Office mobile crews has been Norton’s favorite part of her career. “We want them to be successful and show them that we care and that we’re working hard to create solutions for them,” she said.
