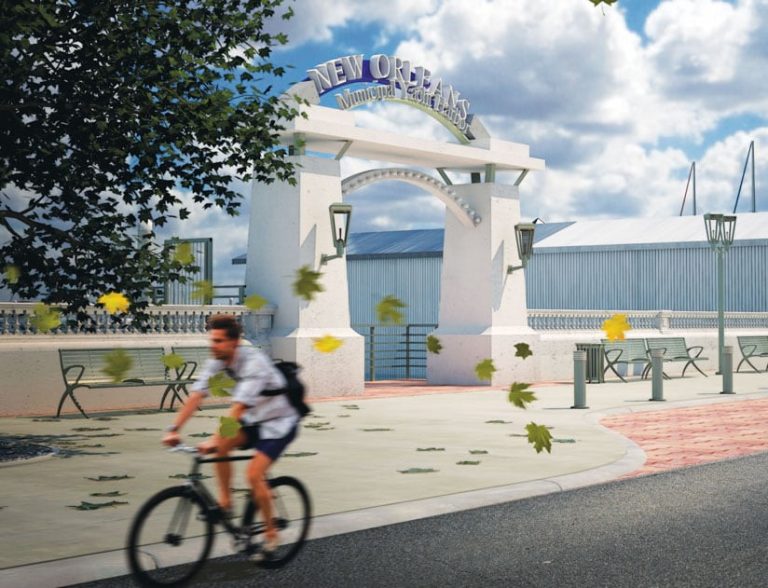
For more than a decade, the New Orleans Municipal Yacht Harbor in Louisiana was in disrepair. In August 2005, it was ravaged by Hurricane Katrina, which severely damaged three-quarters of its 600 slips. As funding negotiations dragged on, the harbor was hit again by Hurricane Isaac in 2012, which destroyed 20 more slips and left the remainder of the marina with no water or electricity.
The City of New Orleans wanted to completely replace the damaged facility with a harbor of increased resilience and sustainability. The new marina would feature a floating dock system. It would need to be durable enough to survive a larger-category hurricane, have additional facility entry points, and meet updated Americans with Disabilities Act (ADA) access requirements.

In 2016, the city finally got the go-ahead to proceed with a total renovation of the harbor. Moffatt & Nichol, a midsize engineering and infrastructure advisory firm that provides solutions to clients in the marine terminal, transportation, energy, environmental, federal, and urban development markets, was chosen to manage the rebuilding efforts.
Working closely with the Federal Emergency Management Agency (FEMA) and the City of New Orleans, Moffatt & Nichol had a tight timeline to get the project off the ground. It was going to be critical for staff to produce clear, convincing visualizations of the final design to communicate with stakeholders and city officials.
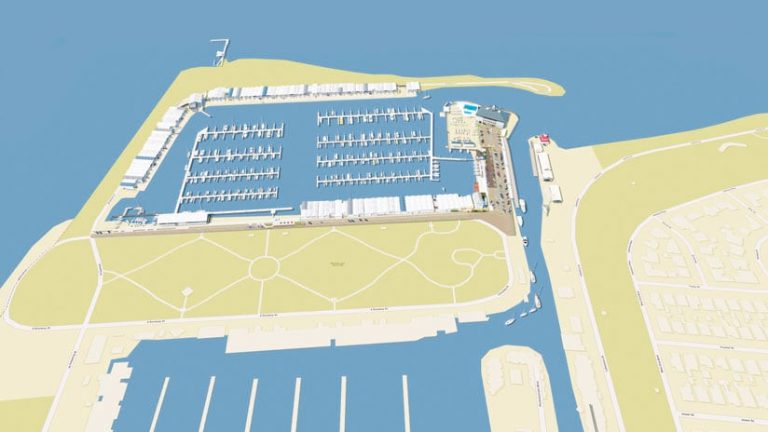
The company needed to be able to present two kinds of visualizations. First were the aesthetic visuals, which would be used to display the differences between the original marina and the proposed new design. Second, it needed technical visuals that designers, engineers, and builders could use for planning.
During projects with less pressing deadlines, Moffatt & Nichol would typically have design staff produce graphics and other information products that the visualization team would then use to create the final models and imagery. But because the timeline for the harbor project was so short, that wasn’t possible. Moffatt & Nichol’s visualization staff had to gather data, create graphics, build out models, and produce all the final visualization tools, without assistance, in less than two weeks.
With no time to spare, the company’s visualization team searched online for ideas on how to accomplish this. One employee—Jeanah Bauer, a visualization specialist at Moffatt & Nichol—discovered the ArcGIS Maps for Adobe Creative Cloud plug-in from Esri. Implementing the plug-in would enable her and her team members to continue working within the Adobe programs they were familiar with while getting the mapping functionality they needed.

“Once I got the plug-in, it had a really easy learning curve,” said Bauer. “For the first time, I was able to easily pull satellite images directly into Photoshop, then turn them into layered files with additional relevant data.”
Installing the plug-in was fast and easy. Soon, Moffatt & Nichol’s visualization staff members were pulling aerial imagery and basemaps into their Adobe software to create the detailed informational map the engineering team needed to move forward.
“In an engineering industry, whether we’re engineers, designers, [or] visualization or graphics people, anytime we discover new technology that can make us more efficient, everybody is very interested,” said Bauer. “We were especially excited to learn how GIS could be incorporated with Photoshop.”
To create the large-scale, high-quality visualization results the company needed without aid from additional staff, the team would have originally started by piecing together high-resolution screen capture tiles—a process that could take up to two days per image. Using Maps for Adobe Creative Cloud, the visualization team was able to accomplish the same results in less than an hour.
“Under usual circumstances, I would have had to obtain data like maps and aerials through our GIS department, adding people and time to the project,” said Bauer. “I would have also required a second modeler or graphic designer to take on one of the tasks, thereby duplicating some of the work and creating a break in the workflow. To save time, the map graphics would have likely stayed 2D and wouldn’t [have been] incorporated into the 3D model.”

The plug-in enabled Moffatt & Nichol’s visualization staff to create detailed, data-rich, layered Photoshop files fast and get these essential planning tools off to the technical team so the rebuilding could begin. Not only did Moffatt & Nichol meet its tight deadline, but the company also did it under budget and without adding more staff.
“I cut my time in half and came in under budget, but most importantly, I kept the City of New Orleans and my project manager happy,” said Bauer.
Once created, the Photoshop files could be quickly moved into Autodesk 3ds Max, and any basemap could be altered during planning meetings with architects and engineers. Being able to swiftly manipulate files made project discussions more efficient and ultimately contributed to getting construction started quickly.
Beyond the scope of the harbor project, Moffatt & Nichol also shared its newly created graphics and visualization tools with the founders of Community Sailing New Orleans, Inc., which aims to provide community members, especially disadvantaged children, with access to sailing facilities. The founders were able to use those assets to solicit funds to start building the community sailing center.
“With the use of [Maps for Adobe Creative Cloud], I was able to create graphics for technical meetings [among] city officials, engineers, architects, and planners, as well as visualizations for community outreach meetings,” said Bauer. “With the addition of ArcGIS to my workflow, I was a one-stop shop for visualization graphics.”

