When a food worker at a popular restaurant in Erie, Pennsylvania, tested positive for hepatitis A in February 2024, the Erie County Department of Health quickly mobilized to minimize the impact on potentially infected restaurant patrons and members of the broader community. The health department swiftly organized a mass vaccination clinic and rapidly developed an ArcGIS Survey123 form along with two dashboards built with ArcGIS Dashboards to register patients and monitor operations.
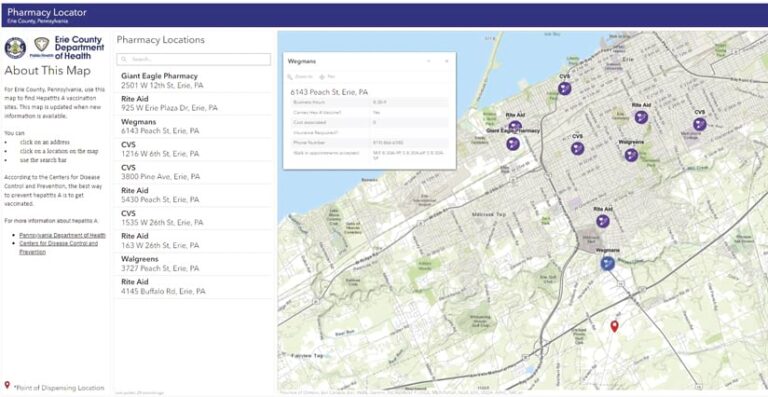
“These tools greatly helped in our preparations and in streamlining our efforts at the vaccination clinic,” said Erin Mrenak, director of the Erie County Department of Health. “They allowed the health department to vaccinate more than 400 residents against the foodborne virus in just two days.”
Activating a Quick Response
Hepatitis A is a highly contagious virus that targets the liver and can cause nausea, fatigue, fever, and even liver failure.
The Erie County Department of Health was alerted about the hepatitis A case on a Thursday. To prevent a widespread outbreak, the health department immediately started working on getting a mass vaccination clinic going near the restaurant.
But the clock was ticking. While vaccinations are effective at preventing hepatitis A, they must be administered to previously unvaccinated individuals within two weeks of coming in contact with the virus.
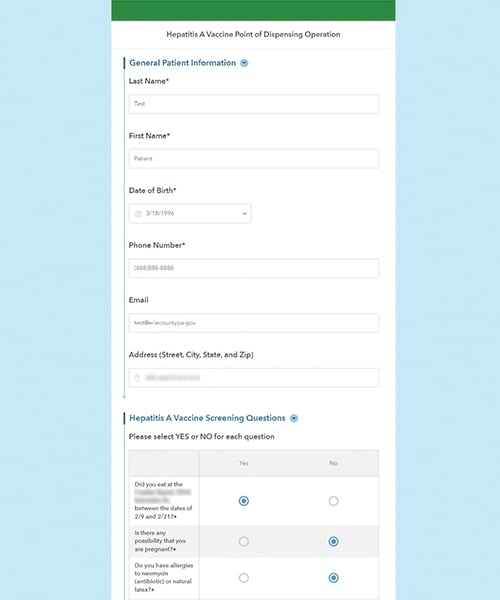
Department staff members used the weekend to create an ArcGIS technology-based workflow that relied on Survey123 to help patients with registration and check-in, and two dashboards to track vaccination operations in real time. The following Monday, the department used local news outlets and social media to encourage people who had eaten at the restaurant in the previous two weeks to get vaccinated. Department staff administered vaccines that Tuesday and Thursday.
Dashboards Streamline Operations
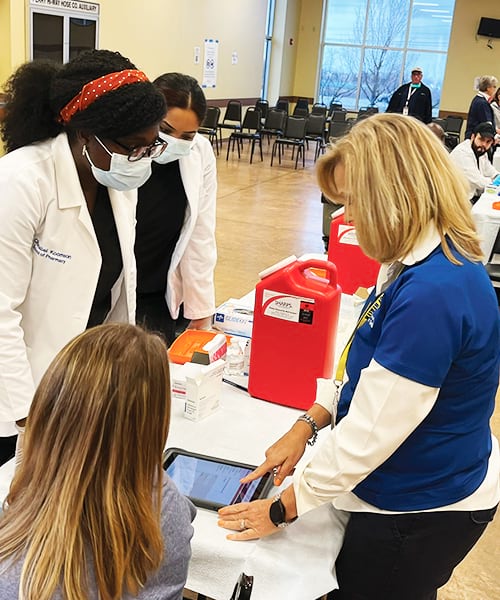
As patients arrived at the vaccination clinics, staff members helped them register using tablets and laptops equipped with the new registration and consent form created with Survey123. This replaced the department’s previous, time-consuming registration process, which involved using paper forms.
The survey employed conditional questions to allow staff and patients to skip certain fields and speed up the registration process. For example, if a patient said they were 18 years old or younger, the survey alerted the patient that they would need to contact their doctor to get vaccinated, since the department was not permitted to administer vaccines to them. The form also provided direction when the vaccination registration process couldn’t proceed because of allergies or other circumstances.
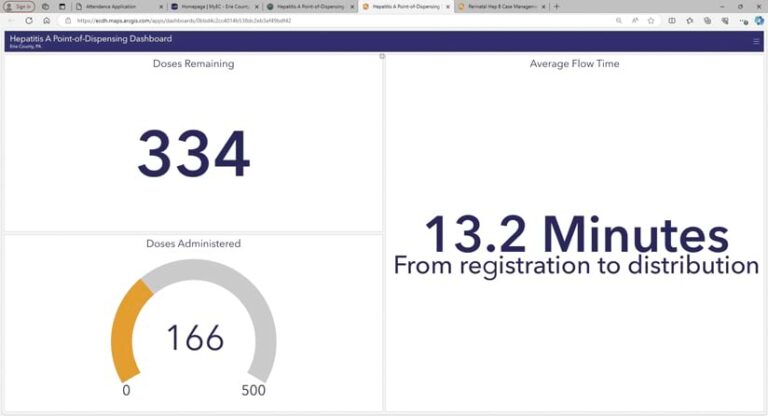
The survey results populated a dashboard that helped staff monitor vaccination center operations in real time. The dashboard allowed them to see how long it took patients to get vaccinated after registering, how much of the vaccine supply had been administered, and how many doses were left. This helped health department staff make critical decisions during the clinic, such as when to release a statement informing the public that no more walk-ins could be accepted.
Another dashboard that was populated using the Survey123 form was a patient queue dashboard that enabled health department staff to monitor who had checked in but not yet received a vaccine. The list in this dashboard was filtered for patients who had filled out the survey but had not received a signature from the medical professionals distributing vaccines, meaning the patients hadn’t been seen. The idea was to ensure that the first people in were the first people out—without making everyone stand in a line. Since the most at-risk population for hepatitis A is people who are 65 years and older—an age group that also frequents the restaurant where the outbreak occurred—mobility issues were a factor. Allowing patients to be seated and called in the order in which they arrived, rather than wait in line, was a great asset to the department and patients.
This dashboard also had a survey embedded in it that was in edit mode. When a patient was selected from the queue list, their registration and consent form was loaded into this survey so it could be reviewed by the staff members dispensing the vaccine. Additional fields that were conditioned to only be visible in edit mode were then displayed. These included the medical staff signature line, a box to record the vaccine lot number, and a check box to indicate which arm the patient received the vaccine in. Later, this data, plus each patient’s immunization information, was exported to the state’s confidential immunization records system.
“This saved health department staff hours of manual data entry,” said Mrenak.
GIS Improves Efficiency
Foodborne illnesses like hepatitis A can seriously impact the health of a community. It’s the responsibility of local health departments to track and evaluate health hazards that originate in places that serve food by managing inspections, enforcing regulations, and educating food workers and the public. When an outbreak occurs, it is up to the local health department to investigate the source of the illness and control its spread.
With this recent hepatitis A case in Erie, a GIS-based workflow helped the health department respond to the outbreak quickly and efficiently. And department staff actually had limited experience with GIS, having only begun a multiyear Esri Advantage Program subscription in 2023. Yet in a matter of days, the department was able to vaccinate 415 patients against hepatitis A, sparing community members the potential effects of a serious foodborne illness.


