ArcGIS Arcade is an expression language created by Esri that gives users the ability to define and save custom content in their web maps. Through Arcade, users set rules that determine how dynamic content, such as text and pop-ups, displays within the context of a map. When an Arcade expression gets saved, any app that an organization creates using ArcGIS technology—whether it’s on the desktop, a mobile device, or the web—honors that logic to maintain consistency wherever the map is viewed.
Although Arcade was initially created for ArcGIS Pro, it also works in ArcGIS Online and ArcGIS Enterprise. Here are three ways that users can employ Arcade in Map Viewer to enhance the look, feel, and interactive elements of web maps.
1. Format Data Values
It’s no secret that GIS professionals are often required to work with messy data. To make this data more presentable, Arcade provides built-in functions that let users format data values in pop-ups and labels.
Change Case
Consider a text attribute in a layer representing parks that stores the name of each park in all caps or even inconsistently, with some park names in all lowercase letters and others in mixed case. Arcade’s Proper function allows users to transform any text value to the proper case.
For example, if some data sources list “LASSEN VOLCANIC NATIONAL PARK” while others show “lassen volcanic national park,” employing the following Arcade expression will format both so they display as “Lassen Volcanic National Park.”
Proper($feature.NAME)Calculate Formulas
Using Arcade, Map Viewer users can calculate both simple and complex formulas, such as the percentage change in an area’s population from one year to another. In the 2020 Census, for example, the town of Poultney, Vermont, recorded a population of 3,020 people, whereas in the 2010 Census, the town’s population was recorded as 3,432 people. To calculate this difference, a user can employ the following Arcade expression:
var current = $feature.pop2020; // current = 3020
var previous = $feature.pop2010 // previous = 3432
var change = (current - previous) / previous;
In many cases, dividing two numbers returns a number with many decimal places, such as 0.12004662004662005—the difference in Poultney’s population between 2010 and 2020. This level of precision, however, is often too high or not required by the end user. That’s why Arcade also enables users to format values so they are more readable. (Learn more about this in the next section.)
Format Numeric Values
Users can employ the Text function to create an Arcade expression that formats numeric values. So a number with 17 decimal places, as in the example above, is automatically cut to two places, or a four-digit year (2023) is displayed as a two-digit year (23).
This function also respects the locale of the map. As people view the map from different locations—say, the United States versus Spain—the number formatting conventions for where the end user is located are honored.
Adding the following line to the previous example in the Arcade expression for labeling would display -12.0 percent in the United States and -12,0 percent in Spain.
Text(change, "+#.#%;-#.#%");
// displays "-12.0%" if locale is English
// displays "-12,0%" if locale is Spanish
Synthesize Data into Meaningful Categories
Some numeric values need to be classified into categories that help a general audience better understand them. For instance, the average person likely doesn’t know whether a value of 30 parts per thousand is a high or low salinity value for the ocean. Arcade’s When function helps give context to raw data values by classifying them in meaningful categories. Here’s how to do this for ocean salinity:
When(
    $feature.SALINITY > 37, "high",
    $feature.SALINITY > 33, "normal",
    "low"
);
// returns "low" if the value of SALINITY in the selected features is 30
When to Apply Arcade to Format Data Values
These examples demonstrate how users can employ Arcade to transform raw or even messy data values into meaningful information for end users. This can be useful in the following situations:
- When the user doesn’t own the data—Arcade only transforms data in a browser. It doesn’t change the underlying data values in a database or web service.
- When the data is updated frequently—Each time a map gets refreshed, any new data values that appear in the underlying database are taken into account and properly input into the Arcade expressions, returning up-to-date information.
2. Visualize Data Layers That the Organization Doesn’t Own
Arcade gives users the flexibility to transform data to create unique visualizations. And users don’t even need to own the data to take advantage of this.
Previously, map authors had to contact the owner of a layer and ask for updates that had been made to the dataset. With Arcade, users can customize and calculate new data values themselves, without editing the underlying data. Since Arcade expressions perform evaluations on the fly, as data is loaded into the map, expressions always use the most current data from the layer, ensuring that maps stay up-to-date.
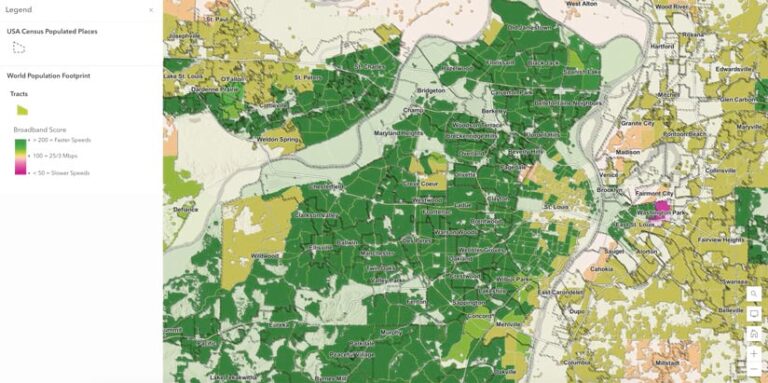
In the example below, Arcade is used to calculate and visualize a broadband score for performance based on data from the Federal Communications Commission (FCC). Arcade calculates the score by using the median download and upload speeds of each census block compared to the FCC’s minimum standard for broadband of 25 megabits per second (Mbps) for downloading and 3 Mbps for uploading, as shown in the expression below. To access this Arcade expression editor in Map Viewer, click the Styles pane, then select the + Expression tab.
/* This score gives 100 points to the median download speed
if it is 25 Mbs or higher. If the census geography has a median
download speed of 50 Mbs, it awards 200 points. If the census
geography has a speed of 20 Mbs, it awards 80 points. */
var downMedianScore = $feature.MedianConsumerDown98 / 25 * 100;

/* This score gives 100 points to the median upload speed
if it is 3 Mbs or higher. If the census geography has a median
upload speed of 6 Mbs, it awards 200 points. If the census
geography has a speed of 1 Mbs, it awards 33 points. */
var upMedianScore = $feature.MedianConsumerUp98 / 3 * 100;

/* Use when() to evaluate conditional expressions and return result.
The average of the two scores is used if BOTH scores
are 100 or higher. If not, the lower of the two scores is used. */
var medianScore = when(
    downMedianScore >= 100 && upMedianScore >= 100, (downMedianScore + upMedianScore) / 2,
    downMedianScore <100 && upMedianScore >=100, downMedianScore,
    downMedianScore >=100 && upMedianScore <100, upMedianScore,
    downMedianScore <100 && upMedianScore <100 && downMedianScore <= upMedianScore, downMedianScore,
    downMedianScore <100 && upMedianScore <100 && upMedianScore <= downMedianScore, upMedianScore,
    100);

return Round(medianScore, 0);
Here’s what this looks like on a map:

3. Conditionally Set Pop-Up Field Values
Pop-ups are essential tools for map authors. They convey information to readers effectively about select features on a map. Within Map Viewer, pop-ups can be enriched with various types of content, including field lists, charts, images, text, hyperlinks, related records, and Arcade expressions.
Typically, the data for pop-up content is sourced from the underlying feature layer or related records that are part of other layers within the map. When authoring Arcade expressions for pop-ups, users are provided with this sourced data. Additionally, users have the option to import FeatureSet data from outside their current map by utilizing the FeatureSetByPortalItem() function.
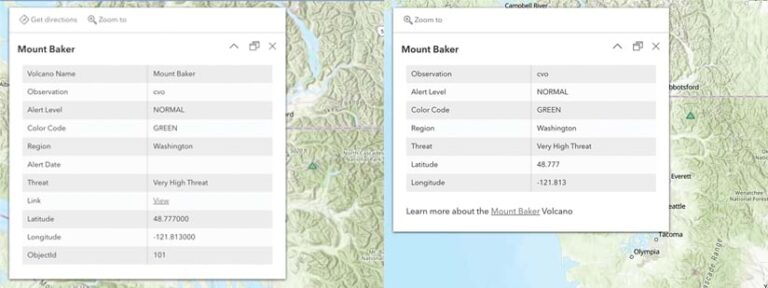
To illustrate this, look at the web map version of Volcano Status from ArcGIS Living Atlas of the World. This dataset takes data from the US Geological Survey’s Volcano Hazards Program to show the status of active volcanoes in the United States. When users select a volcano on the map, a pop-up with a field list displays relevant information about that volcano, such as its name, threat level, and latitude and longitude.
When building pop-ups like these, users don’t need to manually select which fields to display; they can instead use an Arcade expression to craft their own field lists that filter out unnecessary or unknown fields and even show default values for specific fields. For instance, if a field is empty, it is considered uncertain and can be excluded from the field list. Here’s what this looks like before (left) and after (right):

Using Arcade to build a field list also ensures that if this dataset introduces a new field, pop-ups will be updated dynamically. In the final map product, empty fields, duplicate volcano names, and volcano object IDs are excluded from the field list, and the URL is manually moved outside the field list for better visibility.

