How a One-Man Bicycle Survey of Pittsburgh’s Stairways Inspired Further Work with GIS

Pittsburgh, Pennsylvania, is physiographically challenged. Its location at the confluence of three rivers, combined with the land’s undulating terrain, offers unique challenges for getting around.
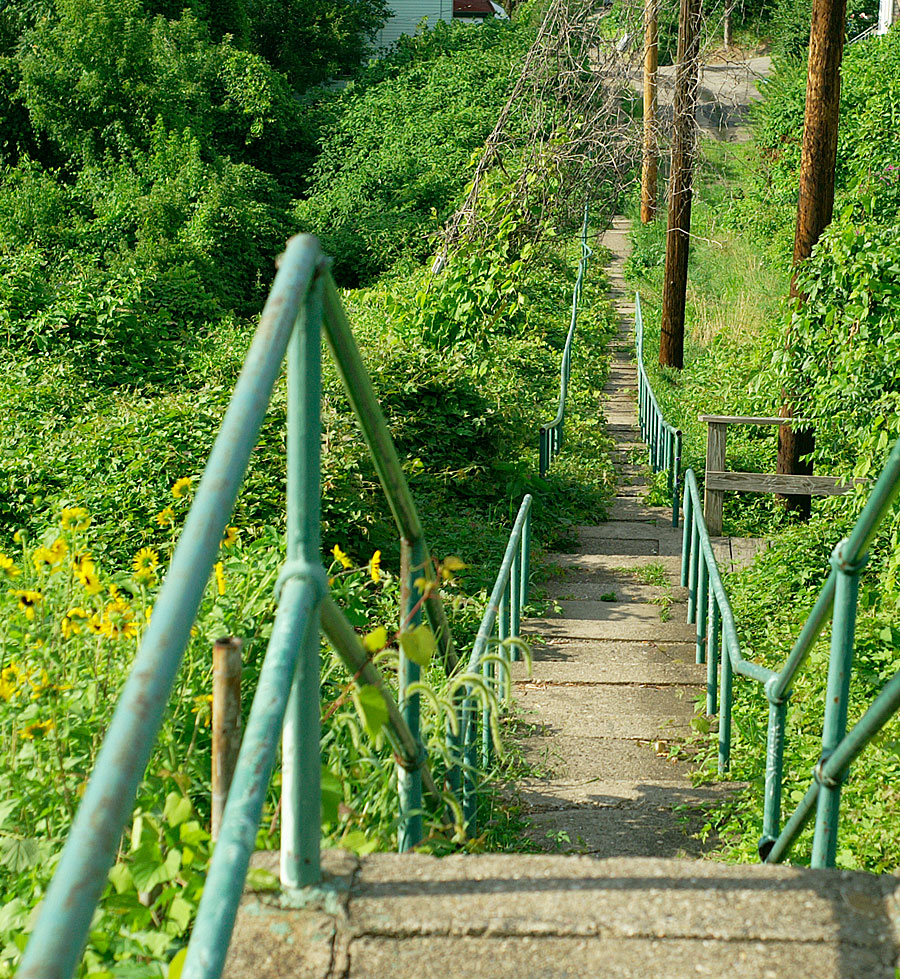
I moved to Pittsburgh in the 1990s, and during my early-morning bicycle rides, I noticed many distinctive public stairways. It turned out, Pittsburgh has hundreds of streets—complete with street signs and often houses—that are composed entirely of steps. These “paper streets” appear as valid thoroughfares on maps and are actually municipal rights-of-way, meaning they are supposed to accommodate traffic, utilities, drainage, and other similar public functions. There are also streets in Pittsburgh that are uncomfortably steep for walking, so they have steps for sidewalks. This is all much to the consternation of unsuspecting motorists and bicyclists.
These “paper streets” and sidewalk steps are a result of the city’s topography and rich cultural history. Pittsburgh has more municipal inclines than any other city in the United States and more city steps and bridges than any other city in the world. So in addition to providing functional modes of transportation (though ones that commuters on wheels certainly have to plan for), the stairways are dramatic and picturesque cultural features that I thought should be recorded, publicized, and preserved.
GIS proved to be ideally suited to study, document, and share the history of these (and more) local urban assets in Pittsburgh. The technology’s cartographic and spatial relational database capabilities not only provide relevant insight and information, but they are also integral for effectively communicating concepts, conclusions, and results.
GIS has come a long way since 1999, with 3D modeling, real-time analytics, and big data capabilities. But even before it was the robust technology that instantly connects whole industries, governments, and organizations to their data and the world, GIS helped bridge paper-based information with a place’s physical surroundings. This generated widespread interest and helped set in motion additional endeavors to better understand the history and space of particular localities.
Here is the story of how this worked in Pittsburgh.
A Neighborhood-by-Neighborhood Survey—by Bicycle
The City of Pittsburgh had a database containing information on 112 sets of public steps. City staff knew there were many more, they just didn’t know their locations. So I decided to do a survey of Pittsburgh and locate all the sets of steps myself.
Fortunately, the city was using GIS at the time, so I obtained data layers of the streets, rights-of-way, neighborhood boundaries, and more. I then conducted the survey manually, traversing all the city streets by bicycle, notating the locations of stairways (at both the top and the bottom), and walking the steps to count how many were in each set and record step width and type. To qualify as a set of city steps, the steps had to be in a street right-of-way or an undeveloped city right-of-way. There was no need for any sophisticated location equipment, since I could digitize the location of the steps off the relevant data layer.
During the four-month-long survey, I traversed more than 1,800 miles of streets throughout Pittsburgh, enlisting the help of a friend and professional photographer to visually document the steps. At the end of each day, I transcribed the data by hand onto a form and transferred the transcribed notes to hard-copy maps. Each set of steps was assigned a unique identification number.
I then entered the data into a digital database. The information included each stairway’s unique identification number, the identification number from the city database (if applicable), the location of the steps, the street name (if applicable), the “to” street (the top of the steps), the “from” street (the bottom of the steps), the type and width of the steps, the number of steps, which neighborhood the staircase was in, the date the data was recorded, and any comments. I also used heads-up digitizing, in which I manually traced a mouse over features displayed on the screen, to put the locations of the steps and their unique identification numbers into a steps data layer in ArcGIS.

Periodically over the course of the survey—usually during periods of inclement weather—I would perform quality control checks on the data. I compared database printouts with my transcribed notes and the city’s database; I selected and plotted all the steps in a neighborhood and compared that plot with hard-copy maps; and I carried out internal checks on the data in the database. Each quality control check took about 40 minutes per set of steps, meaning this alone took 735 hours in total.
In all, the survey located and identified 712 sets of steps, 332 of which are legal “paper streets.” At the time, there were a total of 44,500 steps in Pittsburgh. Each step had a rise of .54 feet, resulting in a total rise of 24,030 vertical feet (or 4.5 miles). The number of steps in a set ranged from 1 to 378. And there are five stairways with more than 300 steps in them.
Updating and Reupdating the Data
Following the project, a friend introduced me and my data to a publisher, who encouraged me to produce a manuscript. The resultant book, The Steps of Pittsburgh: Portrait of a City, was published in 2004. The book generated a great deal of national and international press and ultimately became the publisher’s best-selling book. It sold out and is now out of print.
But 10 years later, the Wall Street Journal wrote a front-page story about Pittsburgh’s steps and my sold-out book, which attracted the attention of publisher Rowman and Littlefield. The publisher asked that I produce a revised and updated version of the book. Since 2004, some interested step-o-philes and I had located an additional 27 sets of steps around the city, so this new data (along with other materials) was included in the subsequent book, Pittsburgh Steps, which was published in 2015.
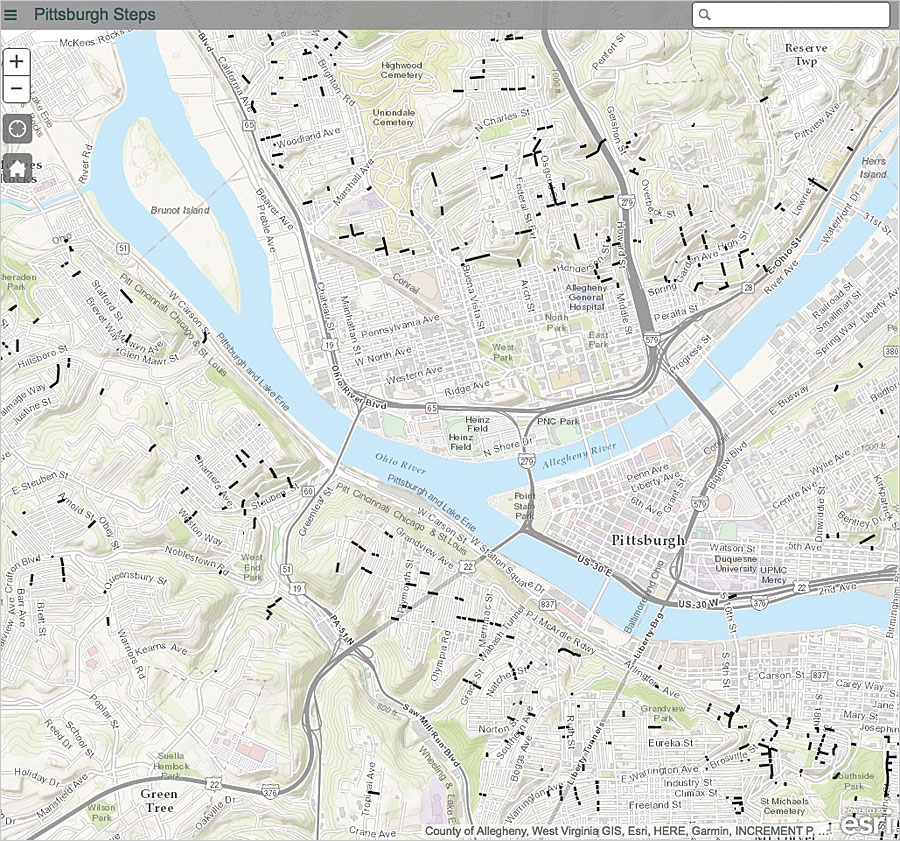
I gave the steps data layer to the City of Pittsburgh after taking the first survey and again after updating it. Esri assisted the city with producing an interactive web map of the steps. Because the project garnered so much interest, the City of Pittsburgh began a program in June 2015 with city employees and volunteers to do a comprehensive survey of city steps—this time using the updated, automated GIS technology of today that makes spatial documentation and spatial awareness ever more accessible. The city is now saving some of the more dilapidated steps rather than removing them, which will preserve and further publicize some of Pittsburgh’s most distinctive cultural features.
Inspiring Similar Projects
I have repeated this feat several times over, using GIS to locate and record extensive information about Pittsburgh’s 447 bridges; the locations of all the city’s present and historic inclines, trolley routes, and sports stadiums; and its 411 churches (in addition to doing similar projects in several other cities around the United States). The results of these research endeavors are published in three additional books: Bridges of Pittsburgh, Quintessentially Pittsburgh, and The Churches of Pittsburgh.
In each situation, I have provided my original data layers to the relevant agencies to complement their extant data. With complete datasets of the public assets they oversee, all these agencies need to do is maintain the data, just like the City of Pittsburgh is doing with its ongoing public staircase surveys.

