Map Viewer Beta is the newest next generation mapmaking tool to make its debut in ArcGIS Online. Inspiring experimentation and creativity, it provides enhanced experiences for key map-authoring workflows. With a dot density mapping style, smart summaries for field attributes, interactive data filtering, additional color ramps, and improved pop-ups, the new Map Viewer helps users explore and map their data in compelling ways.
All ArcGIS Online users have access to Map Viewer Beta through their app launcher and when opening items. In the future, the new Map Viewer will also be available in ArcGIS Enterprise.
Dot Density Mapping Style
Dot density is a new mapping style that’s only available in the new Map Viewer. It personalizes data by representing a count with an individual dot. This style works well with polygon data that contains count attributes, such as census data, incidents, or crime. It can be used to visualize the distribution of one attribute or compare multiple attributes.
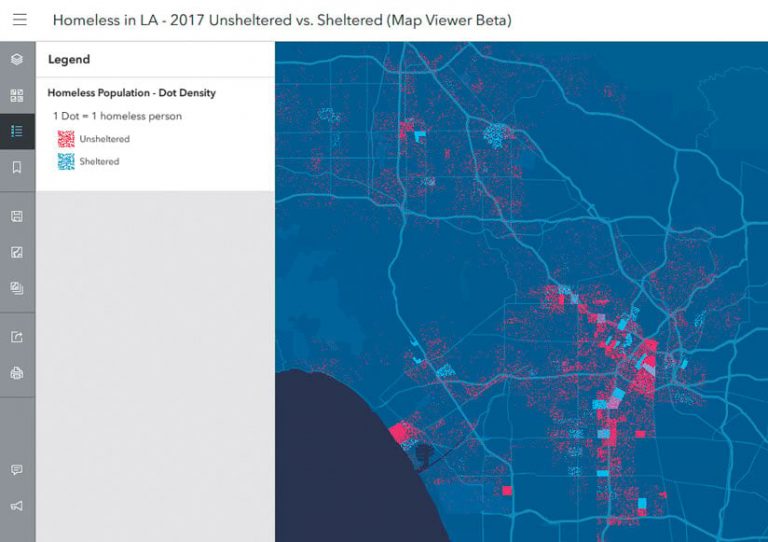
For example, a user can use one point to represent one person experiencing homelessness in Los Angeles, California. Once all these dots are put together on a map, it reveals detailed patterns about homelessness and where it occurs. This is a powerful way to humanize data and make it relatable.
Smart Summaries for Field Attributes
Sometimes a layer has hundreds of fields. This can make it difficult to find and map a particular field of interest. Map Viewer Beta includes a convenient search bar and sorting options to locate fields quickly.
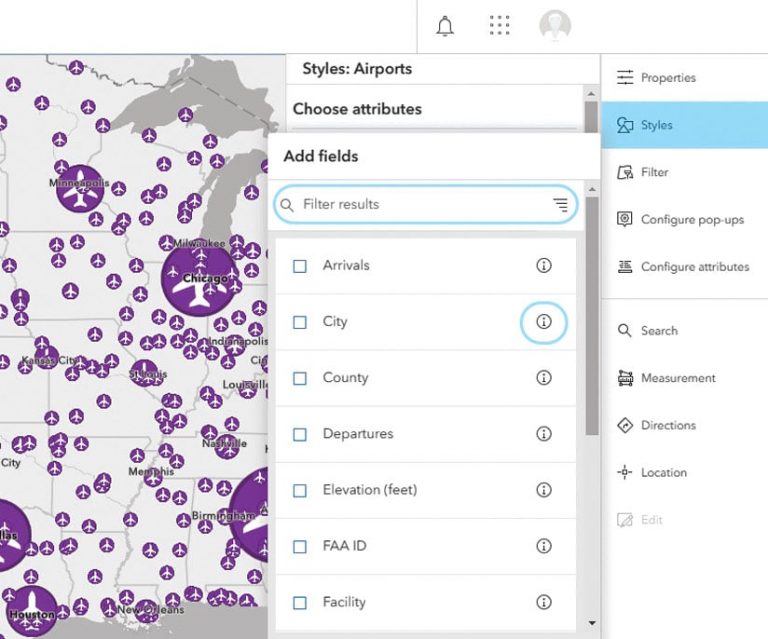
But what about when the field name isn’t enough for users to understand what the data represents? Smart summaries, also available in the new Map Viewer, help by providing a synopsis of each field’s attribute information. The smart summaries showcase many types of field information, including top values, which show how the data is organized; numeric statistics, such as minimum, maximum, average, and standard deviation; and data fields, like oldest, most recent, average, and time span.
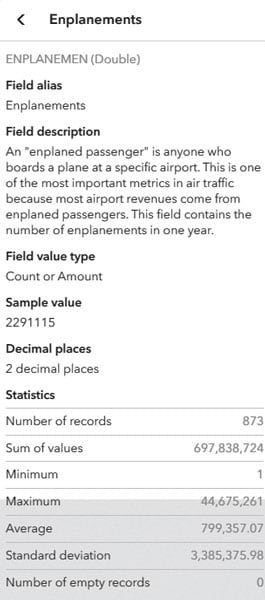
By searching, filtering, and referencing the smart summary, users have an easier time finding fields in a layer.
Interactive Data Filtering
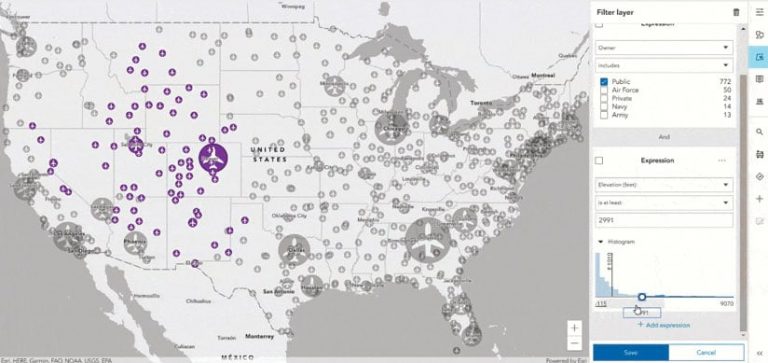
Filtering helps users see the most important features by limiting the visibility of other features in a layer. As users adjust the data filter in the new Map Viewer, it provides instant visual feedback. This interactive experience helps users explore and understand the data before setting the filter.
Categorized Color Ramps for Every Occasion
Map Viewer Beta contains more than 300 color ramps. Each is tagged and categorized so users can easily explore their options and find the best ramp for their data. Categories include best for light or dark backgrounds, bright or subdued, and color-blind friendly. They also show color groupings, such as blues. Additionally, depending on the mapping style and theme, certain color ramps are displayed to guide users to the best combinations.
Improved Pop-Ups
Both the pop-up authoring and viewing experiences are drastically improved in the new Map Viewer. By mixing and matching the pop-up content elements (attributes, images, and text), authors can logically organize information for their viewers. Additionally, authors can easily reorder content elements by just dragging them.
Map Viewer Beta also provides viewers with the opportunity to look at attachment images in a pop-up. Multiple image attachments automatically appear in a carousel. And viewers can dock pop-ups to get a better viewing experience, particularly on mobile devices.

