“The map of the future is an intelligent image” is one of my favorite sayings, coined a few years ago by Esri’s director of imagery and remote sensing, Lawrie Jordan.
Remotely sensed earth observation data—generally referred to as imagery—is the definitive visual reference at the heart of GIS. Moreover, the increasing availability of low-cost, high-temporal sources of data is making imagery foundational for a growing majority of geospatial workflows.
Imagery is a geographic Rosetta stone, of sorts, that unlocks the mysteries of how the planet operates. As Jordan has pointed out, although the technology powering this Rosetta stone is advanced, we can comprehend it in practice when we begin to understand the pictures.
It is indeed easier to understand something when we can see it. But the future lies in what goes on analytically, behind the scenes, to produce that picture.

As is the case with most technological innovation, the future is now. To get a glimpse of this present-future, let’s go behind the scenes and get technical.
What’s so different about this present-future I refer to? Two words: cloud native.
Cloud-native software is specifically designed to take advantage of cloud computing, including its considerable, on-demand resources such as storage and computing power. It is a software development approach in which scalable apps are built and run on services provided by Microsoft Azure; Amazon Web Services; and other dynamic, cloud-based environments.
For some time, Esri has been moving toward cloud-native solutions, including those with multiple types of imagery from satellites, airplanes, ships, drones, and other sensors. This move is to ensure that GIS is scalable to nearly every kind of image and workflow. And it’s all brought together conveniently and efficiently in every kind of cloud—private, public, or a combination of the two—through server network architecture.
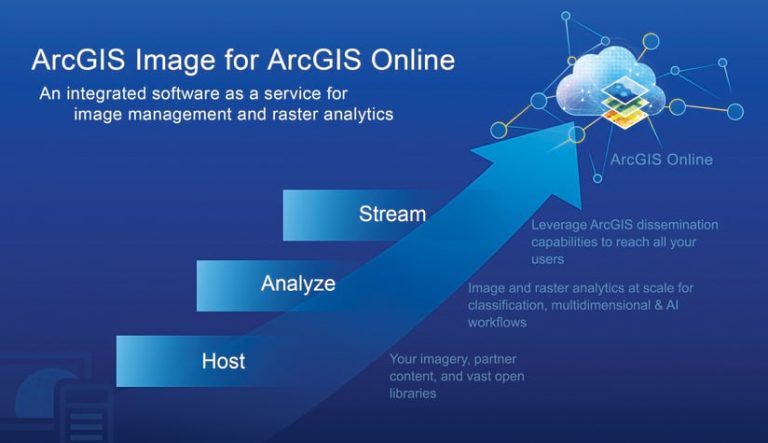
Similar to how real-time information lives in the cloud (think about COVID-19 outbreaks expressed as points), Esri now provides a much easier way for imagery to be incorporated into the ArcGIS environment. The ArcGIS Image product suite, composed of ArcGIS Image Server for ArcGIS Enterprise and ArcGIS Image Analyst for ArcGIS Pro, is now available both as an extension to ArcGIS Online and as a dedicated single-tenant cloud system wherein the server hosts just one user. ArcGIS Image for ArcGIS Online supports image management completely in the cloud and—more importantly for scientists—offers full support for highly scalable image processing and raster analytics.
In terms of image processing and management, ArcGIS Image Online will change for the better how some users handle their imagery, especially those who work at national, regional, and state government agencies and universities that acquire large stores of data. Rather than having to buy the infrastructure or set up their own instances of data warehouses, these individuals and organizations can use ArcGIS Image Online as a service and achieve the same outcomes.
In ArcGIS Image Online, images can be streamed as static tiled imagery layers; intelligent tiled imagery, which maintains the performance benefits of tiling while being able to do pixel-level analysis; or dynamic imagery layers that support mosaicking and on-the-fly, server-side processing. By using drag-and-drop functionality for image files and their metadata, users can instantly host their imagery layers in ArcGIS Online. From the web interface, they can then select the layer configuration, choose the data type, and fill in additional information such as custom metadata types and processing templates.
In terms of raster analytics, ArcGIS Image is especially attractive to members of the scientific community who want to perform big data analytics on large imagery collections directly in the cloud. For example, instead of having to bring data into ArcGIS, scientists (or their organizations) can take analytics directly to their data. If they want to deploy raster analytics right next to existing big data stores or data lakes, that’s a perfect use case for ArcGIS Image Dedicated, a set of services offered to organizations that store imagery in their own clouds. For some scientists, it may make more sense to use ArcGIS Image Online to leverage the ready-to-use imagery services and raster datasets that are stored in ArcGIS Living Atlas of the World, such as Landsat, Sentinel, the National Agriculture Imagery Program (NAIP), and the Moderate-Resolution Imaging Spectroradiometer (MODIS). ArcGIS gives users ready-to-use tools to perform powerful analytical functions, such as anomaly detection, predictive analysis, and artificial intelligence (AI) workflows, in addition to the out-of-the-box collaboration capabilities.
What’s more, the raster function editor in ArcGIS Image provides access to more than 150 out-of-the-box raster functions that can be strung together to create custom image processing chains. Users can use and share these image processing chains as raster function templates in ArcGIS Online, ArcGIS Pro, and ArcGIS Enterprise deployments. Once a template is loaded in the Map Viewer or ArcGIS Pro, users can adjust the parameters and preview the processing results, then simply click Run Analysis to get persisted results.
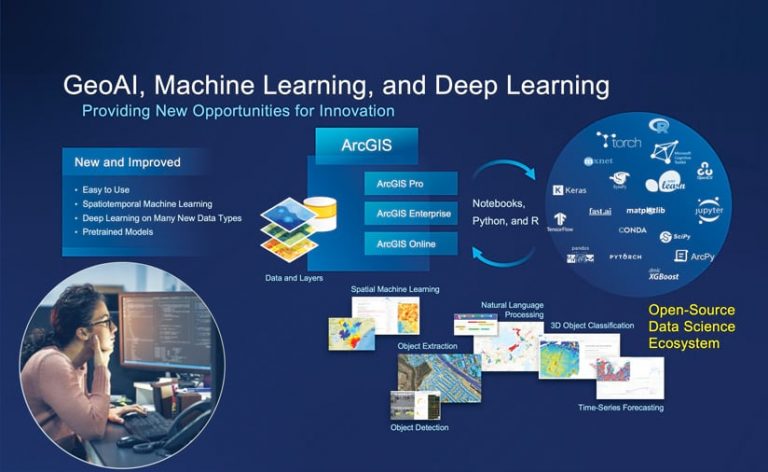
Jupyter-style notebooks in ArcGIS Notebooks can also be deployed in the cloud to build automation, modeling, and machine learning tools right into basic scientific workflows, including an open-source ecosystem.
Esri is taking geospatial artificial intelligence (GeoAI) to the next level as well with ready-to-use models in ArcGIS Living Atlas that can be easily deployed with ArcGIS Image. These newly released models have been pretrained by Esri on huge volumes of data and can be used—with no training required—to automate the tedious tasks of digitizing and extracting geographic features from satellite imagery and point cloud datasets. Anyone with an ArcGIS Online subscription can access these at no additional cost.

So, for example, if you are conducting a burn severity analysis and need to discern how many building structures might be in a wildfire’s path, you can now leverage the deep-learning capabilities in ArcGIS Online to automate feature extraction and extract building footprints in your study area. By selecting Raster Analysis Tools in ArcGIS Image, you can select Deep Learning and invoke the Detect Objects Using Deep Learning tool. You can then specify your input imagery source—in this case, high-resolution imagery provided by Maxar—and choose the relevant model from a library of ready-to-use deep learning packages, including ones that perform road extraction; human settlement detection; land-cover classification; and, of course, building footprint extraction. In this case, you would choose the building footprint extraction model. Running the tool with these inputs extracts tens of thousands of building footprints in a matter of minutes—all thanks to the cloud.
A final example comes courtesy of Esri’s ongoing partnership with the US Forest Service and its Forest Inventory and Analysis (FIA) Program. First introduced to the Esri user community at the 2016 Esri Federal User Conference, the FIA Program has an extensive engagement portfolio with a profusion of resources. FIA researchers Charles H. “Hobie” Perry and Christopher M. Oswalt, along with their team, have been working with all the 30-meter Landsat imagery that’s available for the continental United States over a five-year time series in what is essentially a multidimensional data cube. This imagery is frequently used in studies that examine the relative predictive power of land-cover models—in particular, those related to tree cover—using harmonic regression (HR) as a primary predictor variable. In successive single runs processing HR for the continental United States (with no tiling or mosaicking of multiple runs), Esri has reduced the processing time from 31 days to 33 hours. This means that 21.7 trillion pixels can be processed in 33 hours! Breaking that down even further, when an FIA researcher initiates a job, raster analytics is processing 15.8 trillion pixels per day, 657.6 billion pixels per hour, 10.96 billion pixels per minute, or 182.7 million pixels per second.
At the time of writing, FIA is using only four dedicated midtier, memory-optimized raster analytics machines, managed by Esri Managed Cloud Services, as part of this collaboration. FIA has no need for a massive cluster of high-end servers or supercomputers. For many, this is a clear example of the sheer power and elegance of Esri’s raster analytics software.
Indeed, the map of the future is an intelligent image that is powered by raster analytics. As such, this is a map that can free scientists up to do their best science.
Since we generally understand things much better when we see them, go check out ArcGIS Image in action.


