Highlights from the 2014 Esri User Conference
“I feel like the kid that just found the world’s very coolest candy shop,” said former astronaut Kathryn D. Sullivan and the new National Oceanic and Atmospheric Administration (NOAA) administrator, as she took center stage at the 2014 Esri User Conference in San Diego, California. The first American woman to walk in space, Sullivan marveled at the GIS technology she saw and the people who use it to make vital decisions. “Fabulous toys, spectacular colleagues, great talent, interesting perspectives,” she said. In her plenary address, Sullivan spoke about NOAA’s role as an environmental intelligence agency.

Sullivan and the plenary audience got a taste of how GIS is being used around the globe to make critical and sometimes lifesaving decisions. Presentations focused on humanitarian work, business uses, climate resilience, conservation, emergency operations, transportation, and urban design.
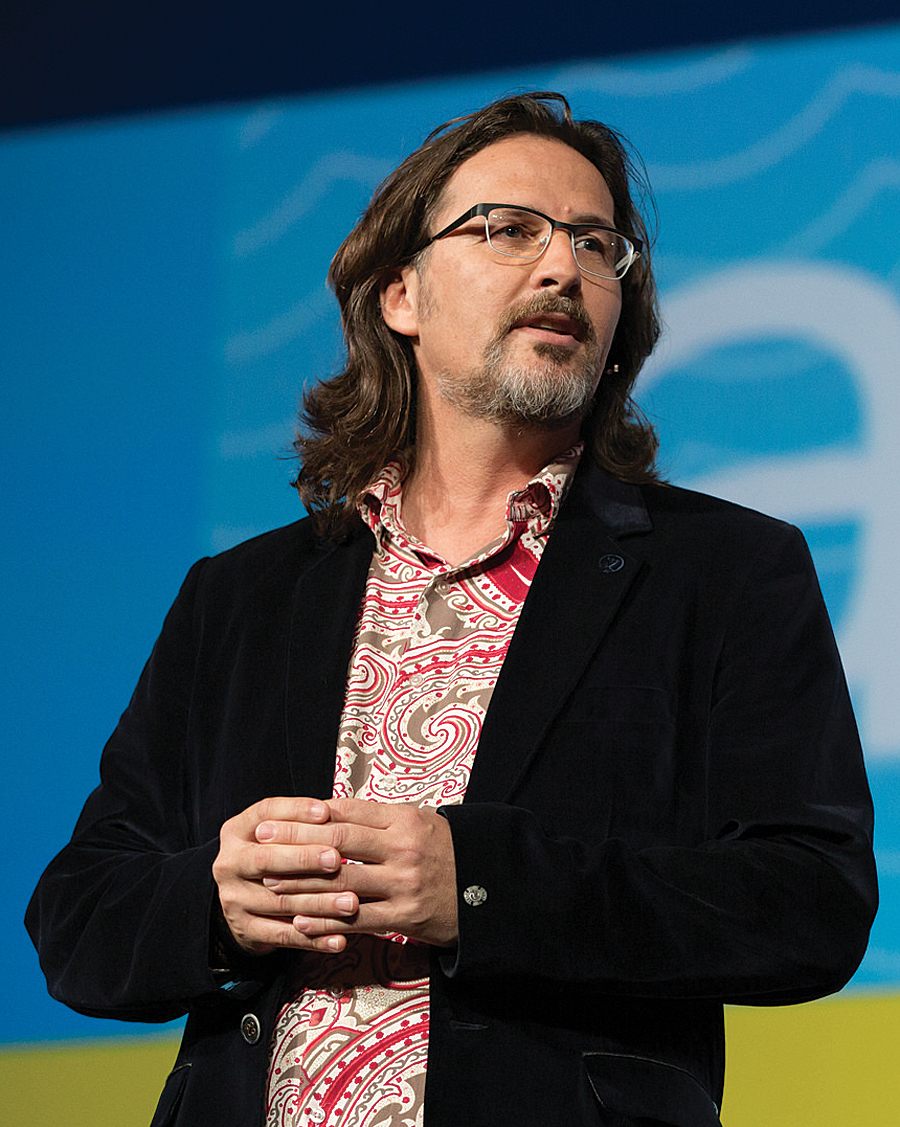
The theme of this year’s conference was GIS: Creating Our Future. People can create a better future using GIS by tackling issues such as population growth, urbanization, the climate, food production, pollution, and energy use, said Esri president Jack Dangermond. “Web GIS is bringing together all our data and connecting it along with our technologies and our people. It’s creating a framework where we can actually work on those very challenging problems.”
Stamping Out Polio
One of those problems is polio, a disease that causes paralysis and sometimes death. Although a vaccine developed in the 1950s eradicated polio in most countries, cases are still reported in a few parts of the world.
The World Health Organization (WHO) and the Bill & Melinda Gates Foundation support the Global Polio Eradication Initiative (GPEI). Currently, attention is focused on eliminating polio in Nigeria, Afghanistan, and Pakistan—countries where polio has been difficult to stamp out.
In their keynote presentation, Dr. Bruce Aylward from WHO and Dr. Vincent Seaman from the Bill & Melinda Gates Foundation demonstrated how GPS, Esri ArcGIS, and satellite imagery were used in northern Nigeria to map dense urban areas with unnamed streets and remote, rural settlements. Having these maps helps get vaccination teams where they need to go and keep track of where children have been vaccinated. Dangermond presented Seaman and Aylward with Esri’s Making a Difference Award.
Managing a Major Port
GIS makes a difference in many other areas, including transportation. Six months ago, the Port of Rotterdam in the Netherlands implemented PortMaps using Esri ArcGIS, Microsoft SharePoint, and SAP. It’s an enterprise mapping application used to manage information about a wide range of operations at the port, which handles more than 350 million tons of cargo annually.
PortMaps’ program manager Erwin Rademaker said the port could no longer expand physically, so to optimize operations, a world-class mapping system was developed to give all users at the port a single point of entry to all necessary information. “Nothing in the port moves without information,” he said.

The system’s components were Esri ArcGIS, SAP, and SharePoint. SAP was used for administrative and financial information and SharePoint for storing all documents and technical drawings. “And in the center, connecting everything with geographic information, there is ArcGIS,” said Rademaker.
PortMaps is simple yet powerful. Only three clicks are needed to access content. “With one click [on] the map, a business manager is able to see where and when a lease is about to expire,” he said. Asset managers can retrieve risk profiles of particular sections of the wharf, the deterioration profiles of the concrete or steel used in a wharf’s construction, Rademaker said.
The secret to the success of the project, said Rademaker, was to make the system simple to use and focus on three major areas in the port: the land, the water, and the border in between the two. “After we did that, it was [easy] for us to transform 1,500 layers of information into 10 single core objects,” he said. The children of port employees tested PortMaps before its launch. “We wanted a system so simple that even a child could use it,” he said.
Brewing at Starbucks
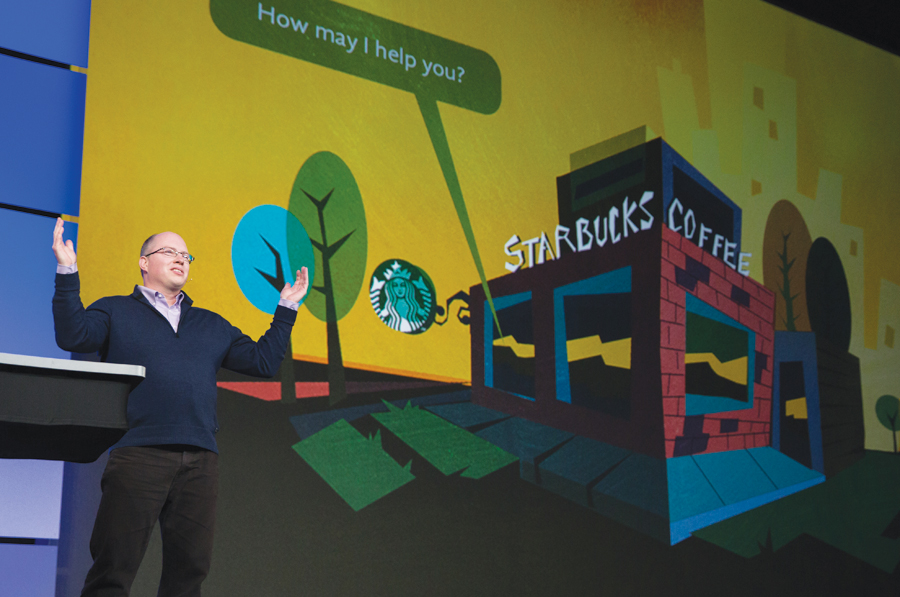
GIS also powers an information system that helps Starbucks decide where to open a new store. That analysis is done in Atlas, the company’s market planning and store development application, which is powered by Esri ArcGIS.
“Atlas has been and continues to be an incredible success story for us,” said Laurence Norton, director of business intelligence strategy and solutions at Starbucks, whose group provides business intelligence to internal business customers. “It’s a large GIS application that includes workflow, analysis, and store performance.”

One of its major uses is to pinpoint the best location for the next store Starbucks plans to open. Patrick O’Hagan, Starbucks’ strategy manager for portfolio strategy and market planning, showed the audience how Atlas works. He demonstrated how Starbucks partner Penny Chen in Nanning, Guangxi, China, can use Atlas to help select future store locations. She can see on a map the local trade areas, retail clusters, demographics, traffic, and transportation nodes.
Chen can also see where new offices are being built—locations that often bring more customers. Referring to the map, O’Hagan said, “For instance, in this part of Nanning, three new office towers will be completed over the next two months.”
After adding a new target area, Chen is provided with a workflow window in Atlas that helps her move the proposed new store site through the approval, permitting, and construction process to its eventual opening.
Starbucks also uses ArcGIS to analyze where its customers spend more money than average on coffee purchases as a way to decide where to install the high-end Clover Brewing System. Clover machines brew one cup of coffee at a time precisely controlling the temperature and brewing time. “The result is the best cup of coffee you will ever taste—hot, aromatic, and incredibly flavorful,” Norton said.
Starbucks also uses ArcGIS to create information products such as a common operating picture for global safety and security at stores. The technology is being used to analyze “wine away from home” purchase patterns to find possible locations for the Starbucks Evenings menu, which will include beer and wine.
“As we look to roll out the Starbucks Evenings menu to more and more locations, we can target existing coffeehouses in areas with high spending patterns,” Norton said.
Addresses and Awards
Penny Pritzker, the US Secretary of Commerce, gave a key presentation on data that included a discussion of the value of open data. Data from the US Department of Commerce agencies helps Americans in many ways. For example, data from NOAA is the basis of severe weather warnings.
As part of extending this commitment to what she called this “open data revolution,” Pritzker announced that the Department of Commerce will hire its first chief data officer.
“Data is a key pillar of our department’s open-for-business agenda,” Pritzker told the audience. “For the first time, we have made it a department-wide, strategic priority to unleash more of our data to strengthen our economic growth; to make our data easier to access, understand, and use; and to maximize the return for businesses, entrepreneurs, government, taxpayers, and communities.”
The Plenary Session also featured talks by Steve Misterek, GIS coordinator for the City of Minneapolis, Minnesota, who demonstrated the MapIT Minneapolis enterprise mapping platform. Victor Chua and Eugene Lau from the Urban Redevelopment Authority of Singapore showed how they used Esri CityEngine for 3D urban planning.
Dangermond gave the Enterprise Award to the Royal Dutch Shell Corporation and the President’s Award to the City of Rancho Cucamonga in California for their outstanding accomplishments using GIS. These presentations and others, including Dangermond’s plenary opening message, are available at video.esri.com.
A Tribute to Roger Tomlinson
The day ended with a touching tribute to Dr. Roger Tomlinson, geographer, the “father of computerized GIS” and a good friend to the GIS community, who died in February 2014. The author of Thinking About GIS: Geography Information System Planning for Managers, Tomlinson always stressed the importance of knowing what you want to get out of a GIS before you design it.
Video clips from past interviews and presentations were playing including one filmed when he and Dangermond received Alexander Graham Bell Medals from the National Geographic Society in 2010. Paraphrasing a quote from Graham Bell, Tomlinson remarked at the ceremony, “I may be given credit for having blazed the trail in GIS, but when I look at the subsequent development, I feel the credit is due to others rather than just myself.” In another clip, he said, “I’m never happier than when I’m surrounded by GIS people.”

