Each day, up to 5 million vehicles travel more than 154 million miles (248 million kilometers) on roads in the state of Massachusetts. The Massachusetts Department of Transportation (MassDOT) builds and maintains infrastructure such as roads, bridges, and tunnels across the state, directed by the department’s Highway Division.
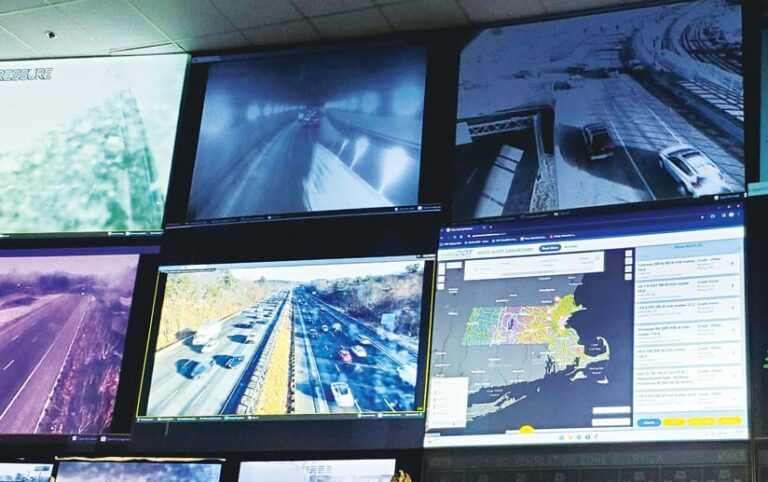
As MassDOT’s around-the-clock traffic management center, the Highway Division’s Highway Operations Center (HOC) in south Boston monitors state roadways and facilities, with on-site staff managing calls and dispatching personnel to emergency events such as auto crashes.

Recently, the HOC wanted to improve emergency response times and handle even more event information, including incident mapping. So the center turned to the GIS team under MassDOT’s Office of Transportation Planning for assistance.
The GIS team deployed ArcGIS Velocity to ingest, analyze, and visualize real-time data. It also integrated data from Waze, a free GPS navigation app that provides traffic updates in real time. This has enabled staff at the HOC to see the most up-to-date information on state roadways across Massachusetts so that they can improve safety and better dispatch emergency personnel when needed.
Identifying Emergency Events
Prior to the Waze-based project, HOC staff identified emergency events by monitoring traffic cameras, local news reports, and X (formerly known as Twitter) and taking phone calls from drivers and state police officers. To get more prompt notifications of roadway emergencies, the HOC wanted to add real-time data to its system. This would allow staff members to dispatch help faster and improve response times.
“A key challenge to any operations center, including the HOC, is to decrease incident detection time,” said Michael Fitzpatrick, superintendent of systems management for the Highway Division. “Incident management begins with detection, and HOC aims to supplement our traditional means with information in an ever more connected world.”
The MassDOT GIS team began incorporating a feed from Waze, which uses a combination of user-generated reports and real-time data from other Waze users to identify traffic hot spots and accidents. But use of the Waze viewer for operational maps and traffic alerts required a specific email account service, and MassDOT wanted staff to be able to access this data without signing in to a proprietary portal. In addition, the HOC wanted to associate the Waze traffic alerts and data feed with information from ArcGIS Roads and Highways, a location reference system solution for departments of transportation to manage route and event data.
MassDOT lead GIS developer Carl Hughes said that HOC staff primarily wanted to be able to see the route ID and the closest mile marker for each emergency event. These details, which were previously unavailable in Waze, would support faster emergency response.

Real-Time Analysis
To help MassDOT achieve its goals, staff from Esri recommended ArcGIS Velocity—a software as a service offering designed to help users ingest, process, visualize, and analyze real-time data feeds—because of its performance and scalability. The GIS team already used Esri technology, and Hughes said he liked that Velocity was cloud hosted, so the GIS team wouldn’t have to maintain a database. He also liked that there was seamless integration with JavaScript Object Notation (JSON), a data format that is supported by Velocity and is one of the Waze feed formats. Hughes chose Velocity because of other features as well, including the ability to control refresh rates, easily view feed-related metrics, and see the number of events coming in.
“You could filter the events quite easily and modify [them] without it breaking or without much downtime,” Hughes said.
The Velocity output—specifically the hosted feature layer generated by Velocity—proved reliable and robust for real-time data, according to Hughes. Additionally, he liked that installation and setup required minimal effort, with little to no coding.
Since the Waze traffic feed updates every two minutes, Hughes wrote a Python script that continuously appends values such as the ArcGIS Roads and Highway fields. The script takes the latitude and longitude of each Velocity feature, identifies it on the HOC location reference system network, and performs a quality assurance and quality control check to see if the feature is a good match.
Velocity also makes it easy to filter out information that HOC staff don’t need from Waze, since the focus for them is only MassDOT-owned roads. Hughes explained that the script helps find the closest mile marker and route measurements through the location reference system and appends that to the Velocity feature. Then, depending on the route ID found, it links to a specific event and hides or deletes other data based on set criteria.
“The Python script complements the Velocity feed, so when it’s packaged all together it [makes] it easy to filter out the stuff that we don’t need,” said Hughes.
New System Benefits
MassDOT has been employing the Waze and Velocity integration for more than a year, and the team has benefited from increased reliability, minimal maintenance, and improved access to real-time data. The HOC now receives Waze data around 2–4 minutes faster than other methods, such as emergency calls from motorists, according to Fitzpatrick. In addition, Waze features, including clustered alerts and alert scoring, indicate visually when an incident is occurring, which helps the HOC deploy assets to the correct locations.
“The new tool provides new efficiencies,” said Fitzpatrick. “Waze users’ data comes from a much broader coverage area—and more quickly than other means. The tool is customizable, provides filtering (white noise), and allows other at-a-glance graphic summaries.”
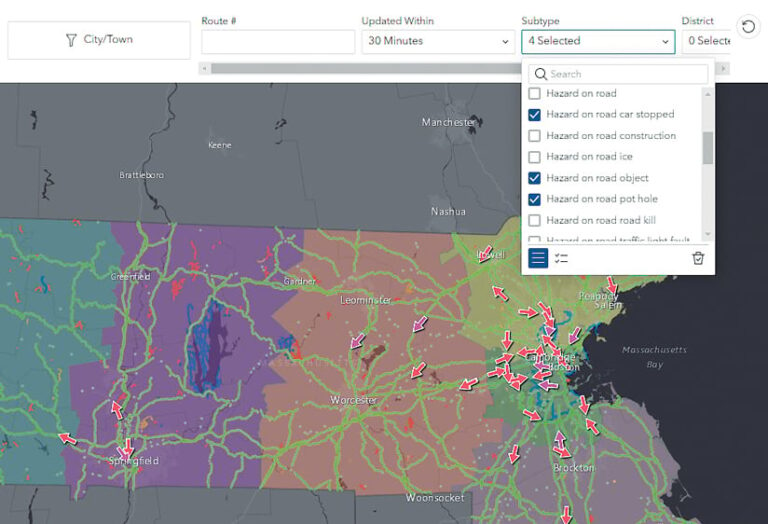
To help staff in the HOC swiftly view real-time data and alerts, the GIS team developed a comprehensive dashboard using ArcGIS Experience Builder. The GIS team set the dashboard to refresh every two minutes, which is how often Waze updates and Velocity pulls the data, so the HOC receives the most current information.

“The new dashboard provides a real-time means of ingesting and displaying mapped alert data from Waze,” Fitzpatrick said. “Operators can quickly look at alerts right on a map and find anomalies, incidents, and nonrecurring congestion. Our traditional methods of detection—phone, radio, CCTV, and field personnel—are supplemented with this new tool in the toolbox.”
Ron Vitale, HOC superintendent of operations management, added, “I’ve seen the dashboard evolve into a very user-friendly tool. Operators have reported that the notifications on the Waze dashboard are accurate and timely.”
Velocity generates an output that, according to Hughes, has streamlined work for the GIS team and increased reliability for the HOC. He explained that the previous solution involved more steps, which included making the schema—publishing, connecting, and registering it—and hoping for a favorable result.
“I don’t have to generate the output and then sort of rely on Velocity to write to it,” Hughes said. “Velocity handles that. I can tell Velocity, ‘OK, generate an output from what I’ve already told you.’”
Hughes also likes that the feature layer hosted by Velocity works well with ArcGIS API for Python, which provides a consistent programmatic experience for scripting across the ArcGIS product suite. Updating with the location reference system wouldn’t be possible without this integration, he said.
Plans to Leverage Velocity Further
MassDOT’s GIS team plans to expand its use of Velocity by using it to get a real-time view of the locations of buses, trains, and subways. In addition, the MassDOT safety team is interested in using real-time Waze data and Velocity to complement its own research and look at historical data to help prevent accidents. With Velocity, the team can retain a customizable archive of historical data for operations, which helps the HOC answer inquiries about recent events.
“As an in-house tool, adjustments and improvements are tested and implemented in a timely manner,” Fitzpatrick said. “The tool appears to be a promising template for the inclusion of additional sources of information, like weather or other data streams, as we move forward.”

