The Port of San Diego is world renowned for its marine recreation, natural scenic beauty, and bustling nightlife. Its carefully managed 34-mile waterfront is home to a variety of businesses—from fisheries, shipping companies, and port commerce to tourist- and resident-focused establishments.
Always open to innovations in problem-solving technology, the port is consistently on the lookout for forward-thinking solutions it can use to streamline processes and improve results. Its staff span a range of specialties, including operations, planning, facilities, environmental protection, and public safety. Each group is focused on a specific aspect of the port’s management, and each regularly collects its own asset data to better understand conditions both above and below the water’s surface.

To develop a better, more cohesive way to visualize assets, the port chose to work with Esri startup partner EarthViews. The web-based mapping company (which is currently being rebranded from FishViews, Inc.) is uniquely suited to the project because of its expertise in integrating panoramic high-definition (HD) imagery with related high-precision aquatic data.
“We began the project envisioning what was possible, but the benefits went beyond even what we thought,” said EarthViews CEO Courtney Gallagher.
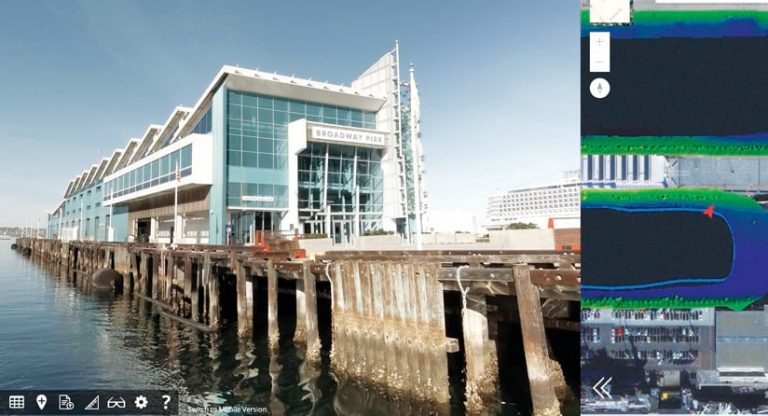
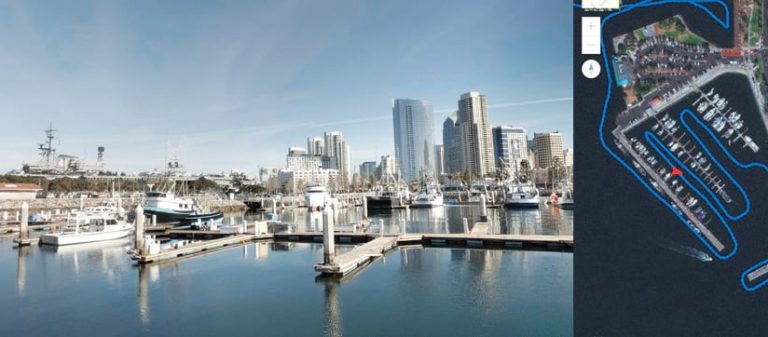
EarthViews built a custom, web-based platform for the port that now gives employees the ability to navigate San Diego Bay virtually. By joining an Esri basemap with 360-degree panoramic imagery of the above-water shoreline and 3D below-water bathymetric imagery, EarthViews generated a virtual experience that enables users to assess and catalog asset conditions, whether they’re onshore or underwater.
“What we created was this visual platform where port employees can now attach data that’s relevant to them—that also might be relevant to other departments—in a place where everybody can get to it and see it easily,” said Gallagher. “It adds additional context to the data that each group is using.”
The platform’s integrated tagging feature allows port staff to add location-specific information and points of interest directly to the surface imagery. EarthViews combined this custom feature with an ArcGIS Online map to create an interactive virtual tour of both the shoreline and the underwater environment. Port employees can also use the ArcGIS Online map to toggle between the above-water and below-water imagery.

The virtual tour gives port employees across all agencies the ability to easily and accurately analyze data from a shared source. This is enhancing employees’ understanding and spatial awareness of the port’s infrastructure and conditions.
“What is so powerful about this project is that EarthViews only had to go to San Diego once to take the 360-degree photos and collect bathymetry data, then integrated that with other relevant information that the port already had; and now the Port of San Diego has this tool to share data in a way that enhances communication and adds value across multiple departments,” said Gallagher. “Because we can continue to integrate the port’s relevant information, it creates this living, visual catalog of infrastructure.”

