A Column from Members of the Urban and Regional Information Systems Association
Standing out in today’s marketplace is a challenge that every company faces. But Dawood Engineering, Inc., a multistate engineering firm headquartered near Harrisburg, Pennsylvania, has found a new way to gain an edge. Instead of using trite slide presentations in meetings and demonstrations, the company now uses Esri Story Maps apps.
These interactive, engaging web apps allow Dawood’s GIS and marketing teams to customize their content—including text, images, videos, and immersive maps—using a variety of templates. When thoughtfully designed, story maps are intuitive and flow logically. They’re versatile, too: users can share them with a simple hyperlink or have them replace traditional tools, such as Microsoft PowerPoint, in formal presentations.
Dawood capitalizes on this flexibility and uses story maps for business development, project summaries, team meetings, and presentations. Here’s how.
A Powerful Tool for Business Development
In years past, Dawood employees used to hand out one-page service sheets at meetings and conferences that outlined what the company could do, from site design and permitting to large transportation projects and land-use planning. But oftentimes, these handouts didn’t foster much meaningful interaction with the recipients.
Now, the GIS and marketing teams illustrate the company’s capabilities using story maps. Taking advantage of its GIS database of all project locations, Dawood’s GIS team can add project-specific details and images to the database. Then, anyone building a story map can include those elements as pop-ups in interactive web maps.
One story map, for instance, summarized all the projects Dawood had completed for the Pennsylvania Department of Transportation (PennDOT) and broke them up by county. An interactive map showed the density of projects across the state using a color gradient, while pop-up windows highlighted one specific project per county, complete with photos and a summary of the work Dawood did.
Dawood’s employees can access the finished story maps online using their laptops, tablets, or smartphones. This portability enables staff to pull from a variety of previously developed apps that they can showcase during impromptu conversations. Additionally, having the hyperlink for a story map is an effective means of sharing this information via email with existing and potential clients.
Since making the switch from pamphlets to story maps, the management team has noticed an uptick in the number of engaging conversations it has with potential customers and existing clients.
“All marketers want a great story to tell,” said Jim Rodgers, chief strategic officer for Dawood. “With story maps, we can show real project data as part of the marketing process. It’s a much more powerful tool than a static pitchbook.”
Making Project Presentations More Dynamic
Dawood has also started using Esri Story Maps apps for individual projects.
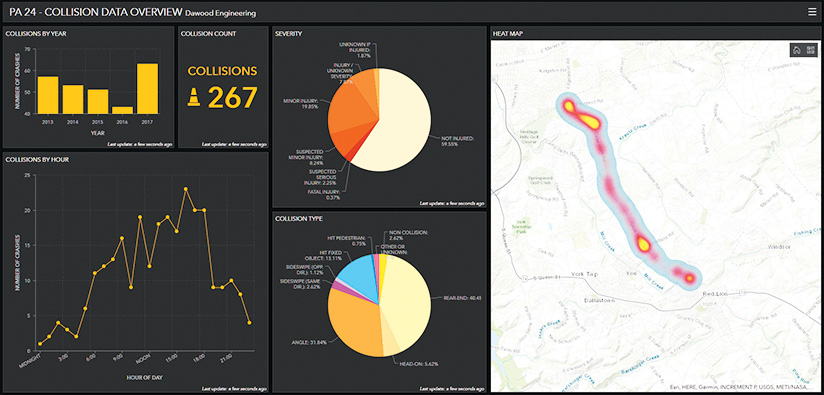
The transportation team, for instance, now employs story maps to show the results of its road safety audits. Traditionally, Dawood presented these via PowerPoint. But the transportation team wanted to do something more dynamic.

With story maps, the team can incorporate interactive mapping and dashboards of crash data into its presentations. These powerful visuals are far more effective at highlighting safety concerns than just using raw numbers or anecdotal evidence. And the feedback has been positive. Both the Federal Highway Administration and PennDOT have lauded this inventive way of summarizing road safety audits.
Dawood’s geotechnical group, which investigates the subsurface of each project and provides recommendations for site design based on its findings, also uses story maps to supplement its final reports.
Conventional geotechnical reports can run hundreds of pages and have countless figures, logs of soil bore findings, and construction diagrams. By putting all this information into a story map that includes embedded web maps, the group can more easily summarize all aspects of its investigation. What’s more, field crews can now access the geotechnical group’s story maps and view all this critical information on-site throughout construction.
Engaging citizens is a priority for just about every civil construction project, and story maps are a great resource for that, too. They can be exhibited at public meetings or featured on municipal websites in lieu of large print maps or rigid PDFs.
Finding a Template That Fits
Esri offers a variety of templates for its story map apps, and choosing the right one is important.
Many of the story maps made at Dawood employ the Esri Story Map Cascade template. It reads like a web page, letting users design a scrolling story map that seamlessly incorporates text, images, video, maps, and other immersive content.
Story Map Series is a great option for presenting project summaries at meetings. It provides tabbed navigation, which is helpful when viewers need to toggle among different sections of content.
Story Map Tour showcases key points along a route or timeline. When Dawood celebrated its twenty-fifth anniversary, it chose this template to illustrate how the company had expanded in both size and geography over the years.
For doing before-and-after comparisons—to show pre- and postconstruction plans, for example—Story Map Swipe and Spyglass is a good choice. The template makes it easy to juxtapose aerial photos taken at different points in time, as well as proposed designs versus existing conditions.
There are several other templates to choose from, and the story maps team at Esri is always developing more. Head to storymaps.arcgis.com to discover what else is available.
Tips and Tricks for Creating a Successful Story Map
A user’s experience ultimately defines how well a message comes across on any medium. Story maps are no different. Here are some tips and tricks for building an effective one.
- Keep story maps simple and on point. Only present the information a viewer absolutely needs to see. Limit pop-ups and minimize how many layers a user can toggle on and off.
- Creating a well-defined storyboard or outline ahead of time can help organize content and determine which template is most appropriate. Develop sufficient text, images, and videos and determine early on which pieces of content will be interactive.
- Embedding one story map within another is a clever way to present different types of material. For instance, Story Map Cascade could serve as one tab in a Story Map Series app, providing an overview of the project. Story Map Cascade could give the background information, such as topography or soils, needed for the project being outlined in the main story map.
- Using static images of maps within one immersive section is a great way to present multiple viewpoints, like all the different utilities on a street (fire hydrants, manholes, catch basins, etc.). This lets users keep scrolling while the images update seamlessly, making the map look interactive. Not only does this give users a more focused experience, but it also saves on bandwidth.
- Take screenshots of the story map or use the Export to PDF function to make a backup copy. Nobody wants their presentation to go from Whoa! to No! if technology lets them down.
- Have a nontechnical user test each story map to ensure that it makes sense to people who are unfamiliar with that project or presentation or even GIS.
Story maps are a powerful communication tool that have helped Dawood unlock its GIS data and make it available for colleagues, clients, and members of the public to see. Why not try making a story map for your next presentation?


