In South Australia, GIS Clarifies the Big Picture, Helps People in Need
Planning social services effectively so that a community’s most vulnerable people are getting the help they need has always been a complex challenge for governments around the world. To help tackle this problem, an innovative government department in Australia has begun applying a geographic lens over its decision-making processes to find an improved way of looking at how it can capture and analyze huge amounts of information to make better decisions.
In South Australia, the Department for Communities and Social Inclusion, based in the capital city of Adelaide, provides services across a state where the population is relatively small, at about 1.7 million people, but is spread over a huge geographic area of more than 350,000 square miles (900,000 square kilometers), much of it arid desert and scrubland. For comparison, South Australia is roughly 30 percent larger than Texas and three times the size of Britain. The department plays the lead role for the South Australian government in the planning and delivery of social services to some of the community’s most disadvantaged people. These are families and communities struggling to make ends meet and often facing multiple levels of disadvantage.
The department has an incredibly broad social responsibility within South Australia. It provides public housing for thousands of people, including crisis accommodation for those in immediate and desperate need, a mother and children fleeing domestic violence, for example. It is responsible for helping homeless people get off the streets and supporting them as they transition into a situation where they can remain in their own home. It runs the state’s juvenile justice system, recently opening a new detention facility with a strong emphasis on rehabilitation and education. It provides services and opportunities to people living with disabilities, assisting them to participate in community life through recreation and work. It provides domiciliary care services to those who need help at home to remain independent, offers multicultural and interpretive services to people who need them, spearheads the state government’s efforts to raise awareness about problem gambling, and manages concession payments to low-income earners. The department works extensively with nongovernmental organizations that deliver many of the frontline services.

In late 1999, a small group of individuals in the department had a vision to use GIS for land-use planning and asset management to improve the way public housing was used in the community. Over the next five years, geographic services became entrenched in many aspects of the business. The demand for services became so intense that the team had to seek a new and more efficient method of delivery. A pivotal point occurred in 2005 for the public housing agency as GIS went from a few scattered desktops to an integrated GIS web mapping solution accessible to all staff, including in geographically remote regions, through the use of Citrix thin clients.
In 2006, departmental executives began to see the advantages of geospatial analysis, mobile data capture, and web-based GIS solutions for information collaboration and why these things should and could be applied to the department more widely. In the years since, GIS solutions have been applied to many projects, including
- Client connectivity to service locations.
- Logistics modeling of vehicle usage.
- Department-wide regional planning and service alignment.
- Community profiling.
- Urban and public housing redevelopment.
- Work force health and safety modeling.
- Supporting recovery efforts after major disasters.
These activities made it clear that a plan was needed to fully reap the benefits this technology could bring to social services planning.
The department now has a geospatial strategy, designed to bring GIS into the center of the decision-making process. It is still very new to the organization, but it is encapsulated in a simple philosophy in line with the department’s strategy: coordinate data under one main umbrella; simplify it to make it accessible to all decision makers; enable people through a range of geographic services like ArcGIS to analyze, visualize, and report the information; and make it available through innovative technology platforms.

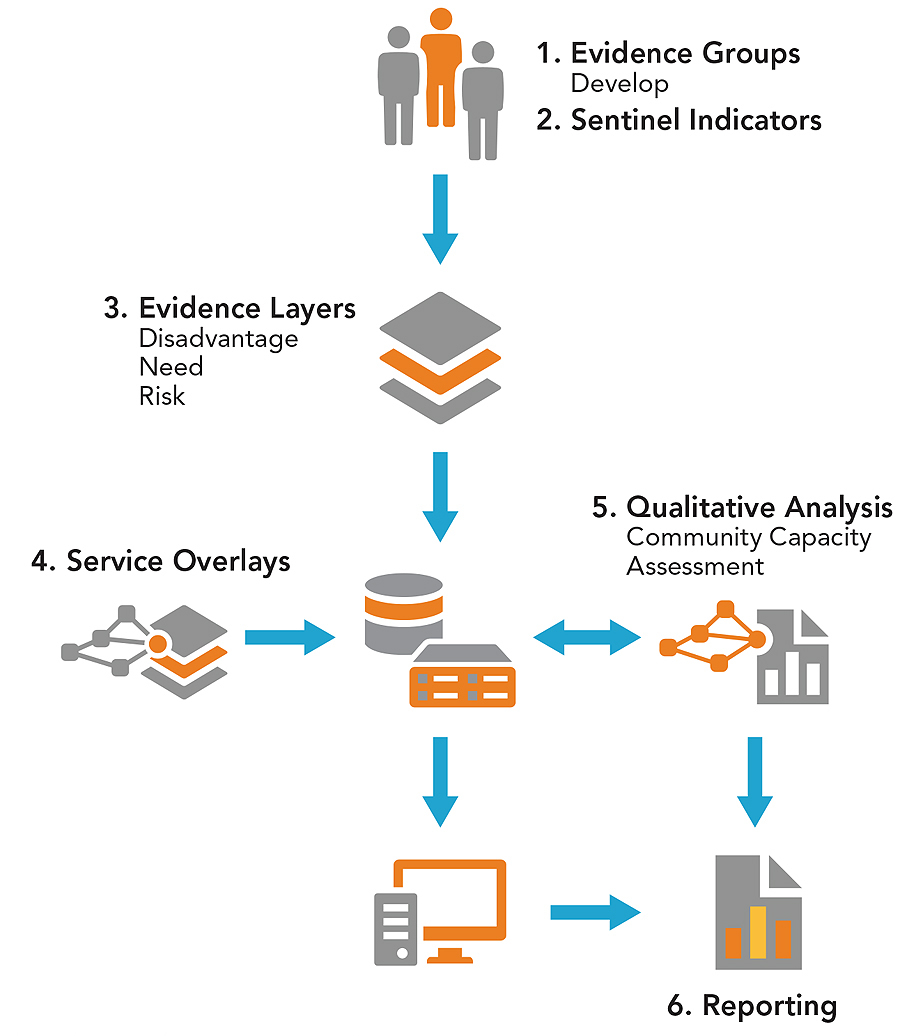
The Evidence Based Management Framework (EBMF) solution has used this strategy throughout many GIS projects. EBMF is the department’s innovative approach to using ArcGIS to arrange and communicate the data and modeling results in a simple and understandable format for decision makers.
The EBMF approach begins by locating the high-risk population groups, regarded as high priority for the department in terms of service delivery. Through early intervention, EBMF identifies the factors that indicate high levels of risk in a community and compiles GIS datasets to measure them. For example, high levels of school truancy could indicate young people in an area are running a higher risk of an encounter with the judicial system. By identifying communities where the risk is high, the department can work at the local level to strengthen and expand existing community networks and services.
By establishing GIS datasets to measure each risk factor, EBMF provides a robust baseline for analyzing and comparing the risk profiles of communities across the state. In the second step of EBMF, the risk measures are narrowed to a group of “sentinel indicators” using a statistical decision tree to model the datasets with the greatest predictive ability. The sentinel indicators are used to establish the Disadvantage-Need-Risk scores, which are a composite measure of risk and identify and rank target populations according to the highest need.
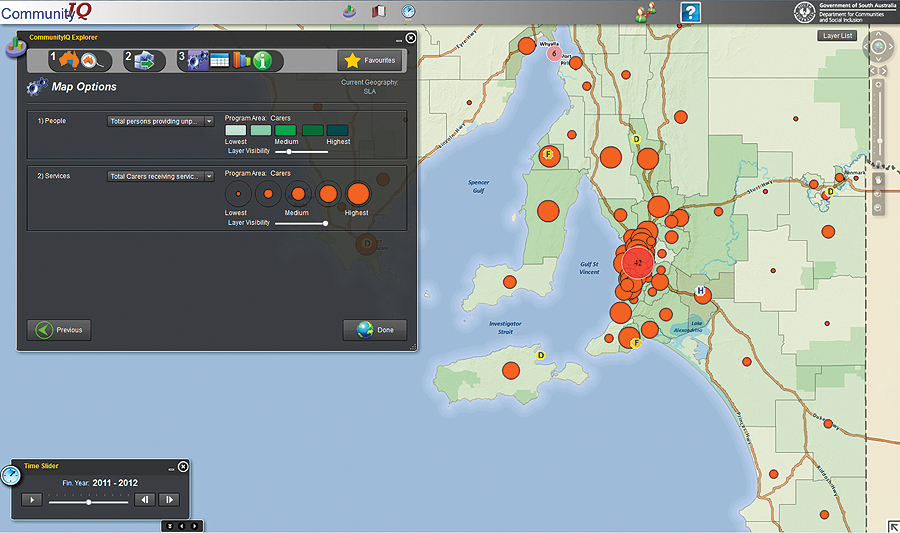
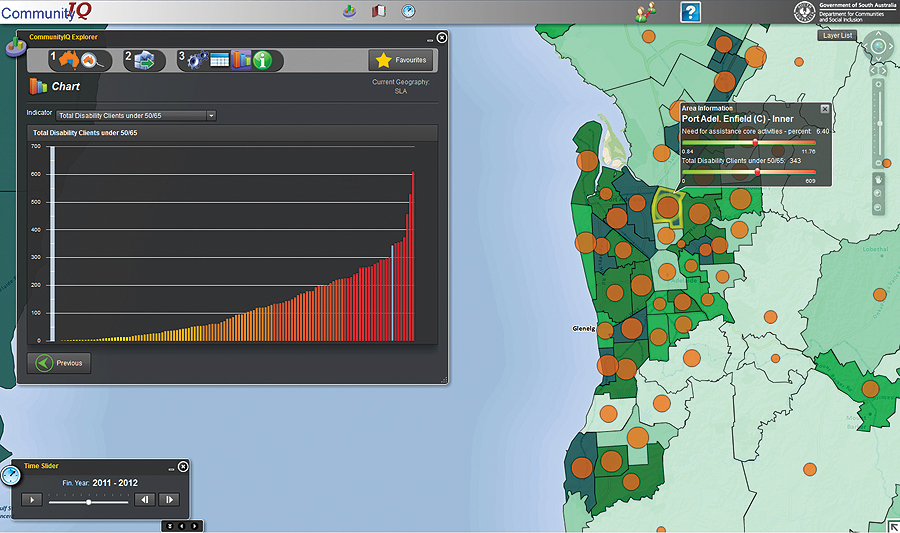
The GIS coordinated service data is overlaid on a map of the target populations, creating an exact picture of where the resources are provided in the community, compared to where the people in need are located. In a true exercise of geoaccounting, the department can compare funding and resource allocation to areas of service priority.

The development of the EBMF information layers is an interactive and collaborative process involving a wide group of contributors, many of them practitioners delivering the services at the front line. The end product is a neat, accurate map with tables and charts, where all the relevant information is in one place and is easily shared as a web service. It means that the program planners can determine exactly where the greatest need is and where the funds are going. Staff in different parts of the department, responsible for planning different services, can view the same information, meaning information is easily shared between parts of the department and seen in context, not in isolation. Those who have worked in a large company or department understand how challenging it can be to source information outside their particular business area, which is why the benefits of this easy and efficient information-sharing process within such large organizations cannot be underestimated. Being able to see it easily on a map means it not only results in less frustration; it also enables a collaborative and open result across different parts of an organization. This sharing of information means that a “whole-of-government-approach” to assisting people in need is more likely to occur.
The EBMF has been presented to some of the nongovernmental organizations the department has partnerships with. The next step is to share information with the wider community development sector. The potential for geoaccounting to break down information barriers between organizations with the same goals and shared aspirations and to deliver better outcomes for society’s most disadvantaged people is enormous.
About the Authors
Gary Maguire and Penny Baldock are with the Department for Communities and Social Inclusion. Maguire is the department’s corporate enterprise manager of Business and Location Intelligence Services. Over the past seven years, he has been leading the organization in transforming the way it uses its corporate systems/information with GIS for business solutions. Baldock is the senior project and policy officer with the Policy and Community Development directorate. She manages the EBMF program and continues to engage all sectors within and outside the department on GIS and the value it provides policy makers.
For more information, contact Gary Maguire, manager, Business and Location Intelligence Services, Department for Communities and Social Inclusion, South Australia.


