A fourth-generation family-run business with a legacy of creating durable high-quality workwear, Carhartt is a large multinational organization with wholesale and direct-to-consumer distribution lines. It operates in the United States, Mexico, and Europe.
As the company set its sights on expansion into new markets and sales channels, it needed to develop a single source of truth for data that would help create a cross-functional, unified strategy to support intelligent decision-making at every level. Carhartt selected ArcGIS Business Analyst for this job.
Fragmented and disconnected data impeded the development of an omnichannel approach to marketing. Omnichannel marketing uses coordinated communication channels to improve customer experiences and improve relationships with customers. ArcGIS Business Analyst unlocked a common and complete operating picture for Carhartt by combining demographic, business, lifestyle, spending, and census data with map-based analytics for market planning, omnichannel expansion, and customer segmentation.
Founded in 1889, the company’s business and technological environments have evolved over the years. It has been making strategic use of GIS and its robust datasets over the last decade to support sales, marketing strategy, and operations.
Balancing Multiple Sales Channels
Since the very beginning, Carhartt’s highest priority has been its commitment to customers. Ensuring that its customers always have easy access to the exact products they need has been a critical underpinning of expansion efforts.

However, customer satisfaction is not the only consideration. Carhartt understood early on that the best way to ensure access to its products was to expand the company’s reach by fostering relationships with a network of distributors and resellers that includes small mom-and-pop retailers as well as wholesale giants. In addition to its own brick-and-mortar stores, Carhart has recently added e-commerce channels.
Expansion at this scale demands an intimate understanding of how growth in one channel might affect adjacent ones. Expansion plans must be assessed to ensure they don’t cannibalize valued members of Carhartt’s network, especially smaller retailers that have been stocking Carhartt products since the company’s earliest years.
Carhartt addressed these challenges by harnessing big data and GIS to create a unified expansion strategy. Disconnected priorities and hearsay data skewed by biases were replaced by a single source of truth that supports every channel and partnership, allowing the company’s safe and confident expansion.
Consolidating Data
Carhartt assembled a data team to consolidate and interrogate data from multiple sources, creating a single source that would guide the company’s expansion while controlling for customer needs and partner relations.
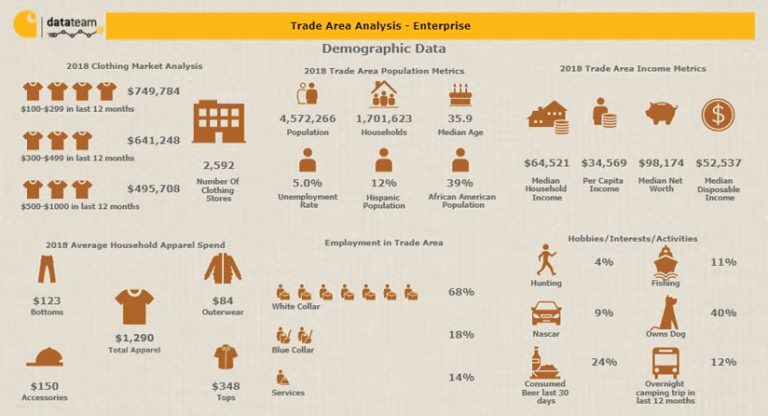
With ArcGIS Business Analyst, Carhartt was able to view its sales data against Esri’s authoritative data—demographics, psychographics, and spending habits—to understand the performance and potential of any market. Traditional data reporting formats, such as complex spreadsheets and static PDFs, have been replaced with intuitive, map-based visualizations and interactive infographic reports that help business leaders at all levels make decisions. They can now answer questions they might never have thought to ask before.
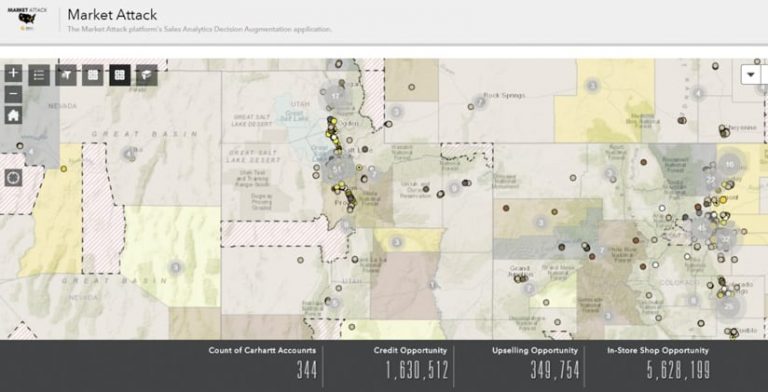
With ArcGIS Business Analyst, the team can now view performance metrics for all sales channels in a single interactive map view that includes Carhartt’s 33 brick-and-mortar locations, its retail distribution partners (big and small), and its e-commerce transactions. Now, when considering a new prospect, Carhartt can see existing channels and performance in any given area at a glance.
“Plotting the big guys and the little guys together in a map really tells so many different stories,” said Steve Brennan, vice president of data strategy and analytics at Carhartt. When pursuing a stronger relationship with a large wholesaler in a given area, the company can generate a visual and interactive risk assessment that uses authoritative data rather than hearsay.
Carhartt’s expansion needed to account for all distribution partnerships. A deeper analysis of its sales data helped it understand whether increased revenue in one channel represented a legitimate shift in buyer habits or was simply moving dollars from one channel to another. Isolated reports of increased revenue in one channel that once appeared promising now tell a very different story: the full picture shows that a nearby channel would pay the price.
Data Analysis Unifies Cross-Functional Strategy
Mapping its rich data to form one clear, descriptive picture was a game changer for Carhartt. Steve Sapardanis, manager of sales and business analytics at Carhartt, emphasized that the powerful visualization tools in ArcGIS Business Analyst were central to this revelation. “You can just literally see the numbers and the color coding that says it’s up, it’s down, it’s plus, it’s minus, with very little words. You let the visual describe itself. That was a way that we have never looked at data and performance at Carhartt,” he said.
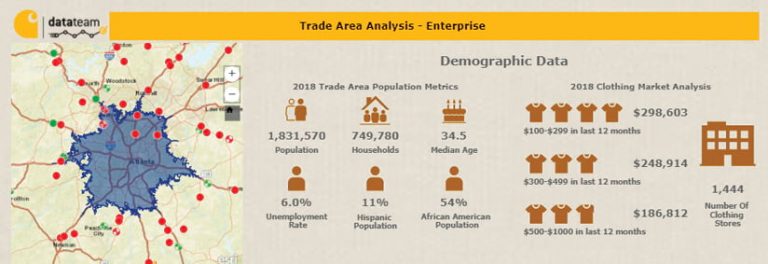
The Carhartt team is also using ArcGIS Business Analyst to deepen its understanding of customer needs. By using the drive-time analysis tool to analyze market potential within a given geographic radius, then overlaying demographics and household spending habits from Esri Tapestry Segmentation, the team can refine market assessments.
By combining Tapestry data with Carhartt’s point of sale (POS) data in ArcGIS Business Analyst, the team can segment customers to help meet demand where it is, down to the most granular level of the product mix. This allows more intentional decisions about where products should go based on demographics, spending patterns, and even which types of Carhartt-centered hobbies—such as fishing or hunting—are popular in an area. The company can better make the critical connection between supply and demand.

Carhartt shares this data with its wholesalers and distributors to help these accounts recapture sales from competitors. The data team uses Tapestry data to rigorously interrogate and corroborate its own first-party consumer data about a given market, ensuring maximum accuracy of analyses. Detailed and visual reports prove whether there is demand for specific products in specific markets.
When considering how to penetrate previously underexplored markets, this repeatable workflow can be used on a larger scale. Historical sales data can be visualized alongside other factors.
“When you can have a picture that shows proximity and shows potential oversaturation—that’s made a world of difference,” Brennan explained. Dwayne Newsome, manager of data engineering, explained that ArcGIS Business Analyst gives the company a visual overview of the entire country, so it can hone in on prospects whose potential may have been overlooked and create robust visual reports for how to enter these markets. ArcGIS Business Analyst can pull that big picture into focus so that the analytical view of a market’s potential or performance is holistic and detailed rather than relying on reductive guesswork.
Thinking Bigger
Since adopting ArcGIS Business Analyst and a more rigorous approach to data, Carhartt has seen a demonstrable, positive shift toward more intelligent decision-making at all levels, from sales managers to executives. Working from a single source of truth has helped bring all the channels together under one unified strategy with accurate, authoritative data as the central, common point.
“It helped make a clearer picture, because retail has its leadership, wholesale has its leadership, e-commerce has its leadership. Having one set of data, and especially the visualizations, helps them make better decisions at a macro level,” Newsome said.
Data presented in maps, interactive web apps, and infographics created with ArcGIS Business Analyst have become a staple in leadership discussions more than ever before in Carhartt’s history and the data team has led the way. As Brennan explained, “We’re the team that comes together and facilitates that true cross-functional discussion to say, here’s what the market looks like, and here is what the data is saying is the best way to leverage that market, or to maximize that market.”
ArcGIS Business Analyst enabled a successful expansion strategy that empowers physical and e-commerce partners and their retail businesses to deliver the products customers want—where they want them and how they want them.
But Carhartt also wants to go bigger. Newsome and Eric Isaak, business intelligence architect at Carhartt, envision a future in which they can use ArcGIS to create interactive web apps tailored to the needs of internal stakeholders, empowering entire sales teams to take the power of GIS and data into their own hands.

With custom-designed web apps to streamline workflows for each user, Carhartt envisions a future where it can empower stakeholders at any GIS experience level to run their own analyses, closing the gap between curiosity and answers across the company. In the meantime, Newsome and Isaak can offer the sales team drillable web-based reports with live-updating infographics in place of unruly Microsoft Excel spreadsheets and static PDFs.
Sapardanis hopes to develop workflows to allow sales teams to capture the layout and merchandizing of all their accounts’ stores. “Imagine if they could just walk in with their phone, and click—it comes back to us, and now we can put it in the mapping tool. That’s where I want us to go, and I think that’s exactly where we’re headed.” Newsome and Isaak think this data could even interface directly with Carhartt’s sales platform, seamlessly integrating with GIS.
Meanwhile, the data team is currently exploring predictive modeling by creating a tool capable of identifying trends and projecting future development. This is a grassroots effort inspired by the team’s desire to ask deeper questions and explore what is possible using its tools and data. For Carhartt, the excitement is palpable and the possibilities are endless.

