GIS Provides Framework for Preparing, Processing, and Distributing Census Data

Until 2010, the African island nation of Cape Verde, located about 350 miles (560 kilometers) off the western coast of Africa, used paper maps to conduct censuses. Aside from the typical challenges of orchestrating a census of more than 500,000 people on nine volcanic islands, the use of paper maps with varied scales made things more complicated: It was difficult to identify enumeration areas (the geographic locations canvassed by census representatives) and challenging to make maps of small areas. Moreover, preparing and working with these paper maps was time consuming and required significant additional staffing.
During the 2010 Census, however, the National Statistics Organization in Cape Verde, known by its Portuguese acronym INE, worked with Esri to understand how location-based technology could benefit its staff across the entire organization. INE also looked to the United Nations’ Handbook on Geographic Information Systems and Digital Mapping (now called the Handbook on Geospatial Infrastructure in Support of Census Activities) to better understand census cartography and improve planning, data collection, and analysis.
“We understood that it was time to follow United Nations recommendations [on] the use of new technologies and GIS in the census,” said Clodomir Pereira, the team leader of INE’s cartography and GIS department. “Also, we wanted to further improve the information we produce with spatial analysis and meet the demand for georeferenced statistical information.”

INE decided to use the ArcGIS platform—including ArcGIS for Desktop, ArcGIS Online, and several mobile solutions—to improve its workflows and business processes. The ultimate goal was to produce and disseminate authoritative statistical information to help Cape Verdeans better understand their resources, economy, culture, and ever-changing society.
Automating the Whole Census Process
For the 2010 Census, INE used ArcGIS in all stages of the operation: planning, enumeration, and data dissemination.
To prepare for data collection, INE used ArcGIS to make its census cartography because, as Pereira pointed out, it is fast and reliable.
“For a census, it is necessary to determine statistical units or information collection areas—enumeration areas or census [blocks]…where the inquirer collects information, so that there is no duplication or omission,” said Pereira. “The census blocks should be easily recognizable, so [their] limits must be clearly visible and represented in a clearly visible scale.”
Thus, INE digitally mapped Cape Verde’s administrative boundaries, roads, and streams, which often serve as natural borders for enumeration areas. The statistics organization also marked each building on the digital maps with a point, gave them all unique geocodes, and classified them according to the type of use. The census blocks from the 2000 Census were put into digital format as well to help with georeferencing. The agency was then able to use all this information to plan its enumeration areas.
During enumeration, field staff used ArcGIS to collect data and report it to management for quality assurance. For data collection, INE worked with Esri Portugal to develop a mobile application that allowed field staff to capture the coordinates of new buildings and send that data to the central database.

“ArcGIS improved the representation of enumeration areas and allowed better control of work during the census operation,” said Pereira. He also stressed the importance of creating maps of small areas, which help with estimates for specific, and often small, populations for which there aren’t reliable statistics.
“Presently, statistical information available for small geographic areas or specific areas is very important and [necessary] for decision making; therefore, the National Statistics Organization decided to conduct a census that responds to this need, so all information collected in the census [was] georeferenced,” Pereira said.
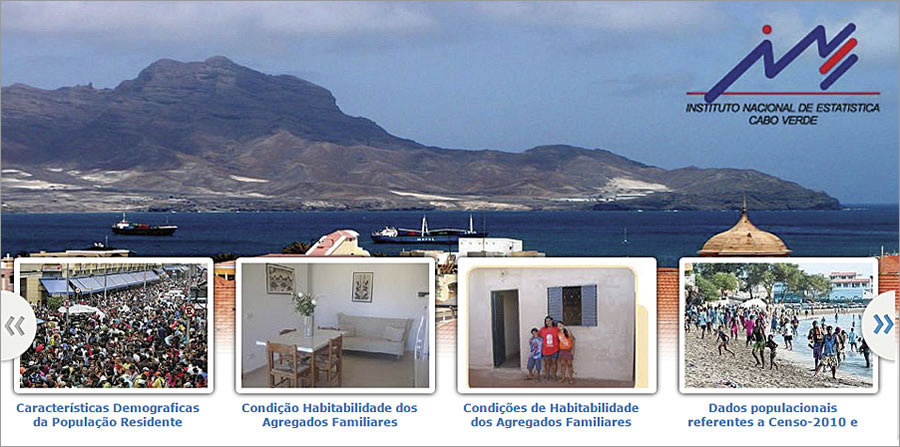
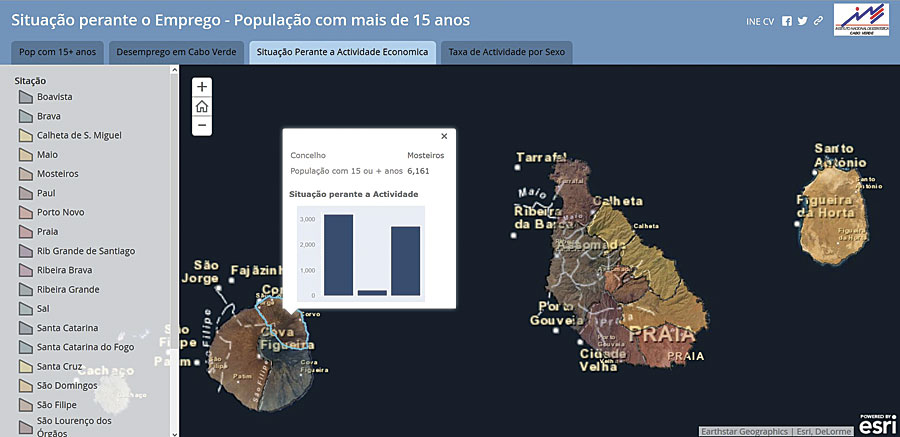
After the enumeration phase, INE used ArcGIS Online to deliver web maps to the public, since the majority of Cape Verde’s population has access to the Internet and it is a cost-effective and easy way to get information to people. These online maps are also of great benefit to government agencies that use census data in their missions, as well as the business community, which needs to understand the nation’s demographics. To satisfy demand for thematic maps by the likes of researchers and university students, INE incorporated interactive maps and story maps into its census website. There, visitors can view engaging information on population counts and change, as well as housing and employment data.
More Accurate Data and Optimized Workflows
While, according to Pereira, the greatest benefit of using GIS during the 2010 Census was improved data accuracy, he also pointed out that doing everything digitally enabled INE to optimize its operational, managerial, and analytical workflows. In fact, for the 2010 Census, INE reduced the number of staff required to prepare census cartography by 50 percent compared to the 2000 Census. It also took INE about 40 percent less time—a few weeks as opposed to a few months—to produce maps with the census data, meaning that the public had access to the 2010 Census results much quicker than it did a decade earlier.
These advantages, coupled with improved internal communication and collaboration, have induced INE to use GIS for an agricultural census and make the technology a critical component of other upcoming censuses.
Leading the Way in Africa
Cape Verde is a technological leader in Africa, where many nations continue to conduct censuses using paper-based processes. INE hosted a Regional Workshop on the Use of Mobile Technologies for Data Collection and Statistical Production in Africa, in partnership with the African Centre for Statistics of the United Nations Economic Commission for Africa, the Partnership in Statistics for Development in the 21st Century, and the African Development Bank. This is among Cape Verde’s many efforts to share knowledge and best practices with other statistical organizations in the region.

