The ArcGIS StoryMaps team continually improves the product to enable users to tell visually pleasing, compelling stories as easily as possible. Over the last six months, the team has added templates, the ability to create interactive charts, advanced embedding capabilities, and more. Read on to discover seven ways to construct more creative and intuitive ArcGIS StoryMaps content.
1. Use Templates for Storytelling
Story templates offer a great way to create a story structure that others can easily build on. They are useful for a variety of reasons. Maybe an organization needs to quickly make similar, consistent stories, or perhaps a teacher wants to provide a framework that students can use to complete digital coursework.
Users can create a template from the Stories page within the ArcGIS StoryMaps builder and build it out the same way they would a story—except they can also include instruction blocks that let anyone building on that template know what kinds of content they should be adding. When others duplicate that template, they’ll be able to modify their copy while viewing the instruction blocks (which won’t show up in the published version of the story).

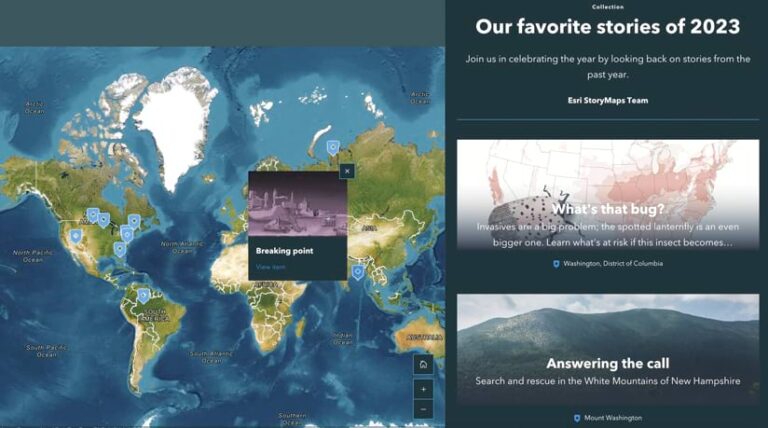
2. Display Collection Items on a Map
Collections group related content together, and now users can organize that content geographically by turning on Show map in the collection’s Design panel. Users can assign a location to as many items in a collection as they wish. Those items will then be represented by points on the map, which readers can use to interact with and navigate through the collection.
3. Use Media as the Base of an Express Map
When media layers were added to Map Viewer in ArcGIS Online, it allowed users to pull an image into a web map—not as part of a pop-up, but into the map itself as its own layer. A similar capability was also added to express maps, the simple reference maps that can be created within ArcGIS StoryMaps.
It gives storytellers the option to use an image as the base layer for an express map instead of a map. This enables users to draw on, add features to, and annotate an image as they would a map. It also lets users employ other storytelling features, such as media actions, to apply interactivity to maps.
4. Preserve the Extent or Scale of Maps
Stories are intended to be viewed across a wide variety of screen sizes. So it’s important to consider how the various elements of a story—especially media such as a map—will appear on different devices.
A new Map view option helps users ensure the optimal viewing experience for their maps by choosing whether a map will maintain the desired extent when viewed across different screen sizes, or maintain its scale instead.

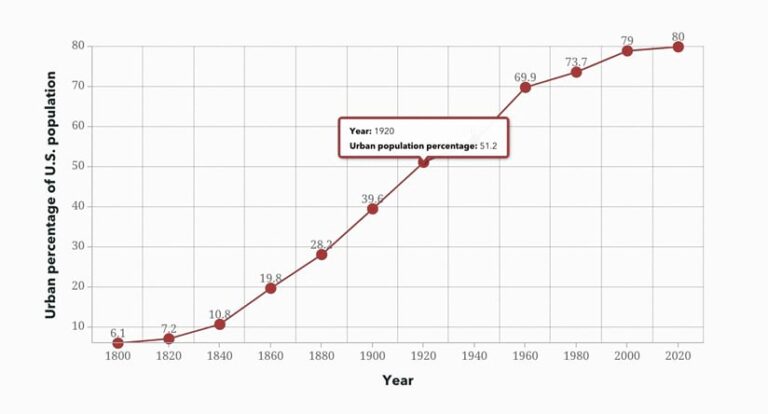
5. Show Data Trends with Charts
Charts can carry a lot of narrative weight, add context, and incorporate a different way to visualize concepts. Users can now create interactive charts directly in ArcGIS StoryMaps. They simply plug in data and choose from a handful of chart types, including bar, column, line, and donut.
6. Seamlessly Embed a Story on a Web Page
The new script embed capability offers an alternative way to embed a story, freeing users from the limitations of using an inline frame. After enabling advanced embedding in the story settings and designating the domains where that story can be embedded, users have full access to the story interface through their web page’s CSS and JavaScript. This means more control; advanced customization; and a smooth, integrated user experience. Once script embed is activated, the story and web page content live together and can interact more seamlessly.

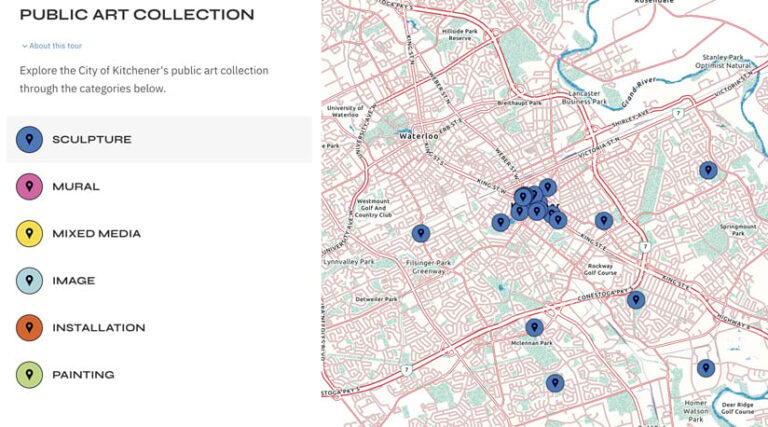
7. Categorize Map Tour Items
As one of the first major features added to ArcGIS StoryMaps, map tour has long been a go-to block for immersing readers in place-based content and information. Now, map tours have a new dimension: the ability to categorize the items in the tour by breaking them down into thematic groups.
This helps readers easily navigate larger datasets by focusing on specific points of interest such as historical landmarks, dining spots, or nature trails, resulting in a more personalized and interactive experience. The option to categorize map tour items is currently available when creating a map tour using a feature service—though in the future, users will be able to create a categorized tour from scratch as well.

