Many municipalities have detailed and enigmatic zoning codes. Oftentimes, these can be quite challenging for homeowners to navigate when they want to renovate or expand their homes.
In the City of Newport Beach, California, the zoning code contains more than 300 pages of complex development standards that apply to a tapestry of subdivisions that have popped up since the city’s incorporation in 1906. Within the city’s zoning code, there are also standards for building setbacks—the distance a structure or part of a structure is set back from the property line. But these can differ from one residential district to another.
In 2017, the planning department at the City of Newport Beach approached the GIS team to find a better way to maintain and display setback data. As the lead on the project, I chose to bring the city’s legacy tabular setback data, plus a set of static setback maps, into a centralized GIS polygon layer. To do this, I used ArcGIS Desktop and Geocortex Essentials from Esri partner Latitude Geographics.
Unconventional Setbacks
In the United States, most cities adopt their setback requirements through zoning codes to regulate building site areas and control what their streetscapes look like. Setbacks are usually classified by a parcel’s property lines—the front, sides, and rear. For instance, a standard low-density residential property with a rectangular shape would have a setback of 20 feet in the front, 3–4 feet on the sides, and 10 feet in the back.

In Newport Beach, however, this standard is not uniform. Some areas have alternative setbacks that have been codified into the municipal code. Thus, the city has varying setback standards based on factors such as the width and shape of a lot, how close it is to the harbor, and its adjacency to an alley. The City of Newport Beach’s zoning code also references 59 individual planned communities that contain their own specific setbacks and standards. Additionally, there are several unique properties in the city that don’t meet any of these standards. These properties require city staff to review and define site-specific setback determinations and then get them approved by the city’s planning commission.
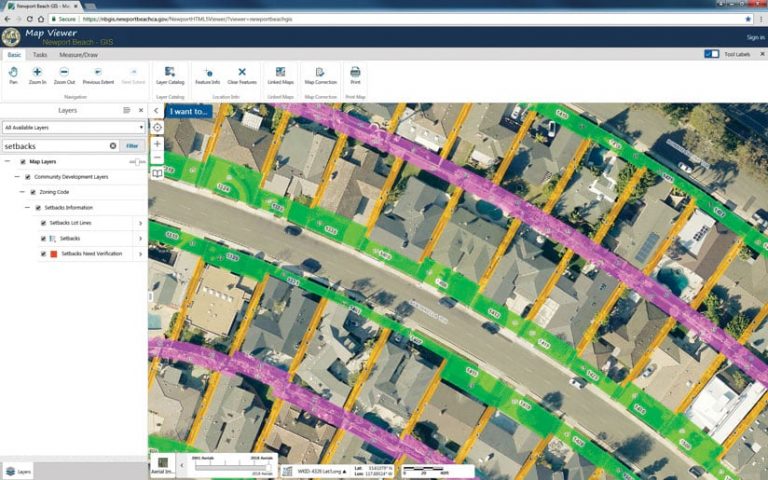
Although Newport Beach’s zoning codes can be overwhelming, the city uses GIS to display setback requirements visually. This ensures that planning staff and residents are applying the correct setbacks to each property. But the city wanted to be able to maintain this data dynamically and was keen to give staff and residents more ways to access it.
A Lot of Data, a Lot of Detail
Using ArcGIS Desktop, the general workflow for creating the setback data was to use the city’s existing parcel polygon data as a base and cut the parcels into their designated setbacks. Newport Beach has more than 29,000 parcel features, and approximately 26,000 of them are zoned for residential use. That means that 26,000 parcels require setback information—and, at the outset of the project, they had to be edited manually.
One challenge I faced while getting the setback data into a centralized GIS feature class was cutting the polygons using a trace and offset. This has the potential to create slivers—polygons with a very small shape area that are hard to see. They sometimes end up displayed on property reports as extra fronts, sides, or rears of buildings, when they actually don’t exist at all. I used quality control checks, like querying shape areas below a certain square footage threshold, to help identify these slivers and either merge them into an adjacent setback or delete them if they’re redundant.
Another challenge was figuring out which side of the property was actually the front, side, or rear setback. In general, the front of a house is normally the property line that faces the street. But in Newport Beach, there are some areas where this is not the case, such as when a house butts up against the beach, a cliffside, or the harbor. In addition, many properties have more than one front setback.
Instead of having GIS staff hem and haw over the setbacks of each property, the GIS team decided to release the data into the Geocortex map viewer as soon as possible so planning staff could perform quality control on the data organically, while using the application. Having staff from the planning department not only consume the data but also contribute to its quality gives them ownership of it and is essential for the longevity of the data.
To display the setback data, I leveraged the City of Newport Beach’s internal Geocortex web map viewer. Now, all city staff and Newport Beach residents who visit the city’s planning counter can view setback information for individual properties, which helps them with renovation and permitting.
Maintaining a Dynamic Layer
Parcels are not static features. They get merged, split, and reshaped over time. Many of the city’s GIS layers are dependent on the ebb and flow of this parcel base. As such, the City of Newport Beach’s GIS team does continual maintenance on its parcel data.
When the setback layer became part of this base, it had to be added to the parcel maintenance workflow. One idea for how to do this was to automate spatial queries so they could find any geometric inconsistencies between parcels and their setbacks. Ideally, all setback polygons can be aggregated and dissolved into a single polygon that’s identical to its underlying parcel. So using ModelBuilder and Python scripting, I developed an automated geoprocessing tool that dissolves and compares geometries. This enables the city’s GIS staff to address each inconsistent record individually.
A More Comprehensible Zoning Code
For the City of Newport Beach, bringing its legacy setback data into a centralized GIS feature class has been beneficial to planning staff and residents alike. The setback layer has become an invaluable tool that bridges complicated zoning policy with comprehensible cartographic visualization.
For more information about maintaining and displaying setback data using ArcGIS technology, email City of Newport Beach GIS specialist Jordan Baltierra at jbaltierra@newportbeachca.gov.


