Q&A with Jeff Dulin, International Association of Fire Chiefs

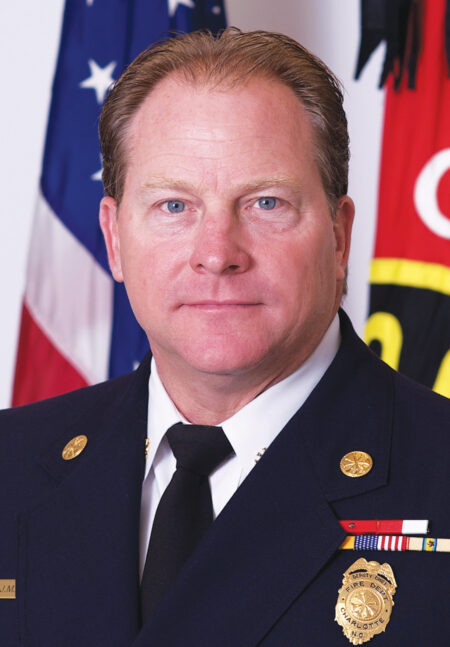
The International Association of Fire Chiefs (IAFC) represents the leadership of firefighters and emergency responders around the globe. Its members are the world’s leading experts in firefighting, emergency medical services, terrorism response, hazardous materials spills, natural disasters, search and rescue, and public safety policy. Jeff Dulin, a retired deputy fire chief from the Charlotte Fire Department in North Carolina, serves as assistant director of the IAFC Research and Data Analysis Center.
To respond rapidly to recent hurricane events, Dulin, his IAFC team, and members from the National Alliance for Public Safety GIS (NAPSG) deployed a solution that used Survey123 for ArcGIS to collect data and Web AppBuilder for ArcGIS to share it with local first responders. Here, Dulin discusses this work.
Q: What prompted you to build this solution?
A: Hurricane Harvey was approaching, and we found out from Florida, North Carolina, and Tennessee that they were sending resources to Houston. We needed to give these teams a data collection tool that would record what they were doing in the field and push that data in real time to decision-makers. Since the rescue workers were unfamiliar with the Houston area, we needed an application that could geolocate their work.
Q: How did you develop it?
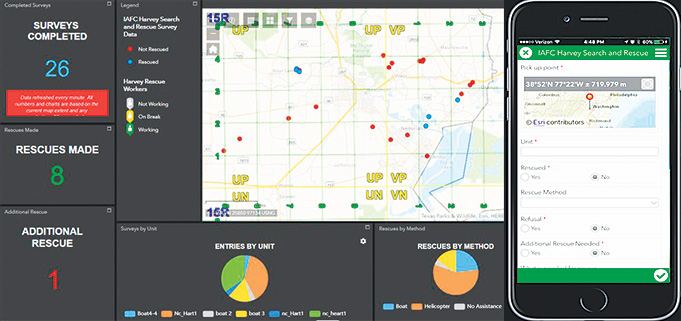
A: We started with prehurricane deployment on a Friday night and used Survey123 for ArcGIS to build the survey over the weekend. With the Web AppBuilder for ArcGIS dashboard template, we built a dashboard that could take the data we collected and show the number of rescues, contacts, impacts, and hazards. We got help from Esri’s Disaster Response Program to pull everything together on Monday and Tuesday.
Q: What data did rescue workers need to collect?
A: The survey we built recorded the location of people in distress, who they were, when and how they were rescued, their condition, and where they were taken. It also recorded impacts to infrastructure at that location and any hazards. It’s basically all the information you may need in an incident report, including photographs to show the extent of the situation.
Q: How was the solution deployed?
A: Rescue workers were using the app on smartphones from rescue boats and helicopters. They would search an area of impact, locate a victim or hazard, and collect and record data. In the pouring rain, it’s much easier to work with a device rather than a paper form. During Hurricane Harvey, we had 20 teams, and during Hurricane Irma, we had 40 teams.
Q: What was the benefit of making this information available right away?
A: We were able to immediately upload information and photos to incident commanders, team leaders, and emergency operations centers. Normally, it would take 12 hours to get this information, as incident commanders would have to wait until the end of the rescue workers’ shifts to see their reports. If the incident commanders can see the information right away, they can manage resources more efficiently. The feedback we got was that it lightened the load of people trying to track and document what was happening, when, and where. They didn’t have to worry about going back later to track, which meant decision-makers had the real-time information they needed to make decisions.
Q: How did the geolocation capabilities of ArcGIS help?
A: We had real-time geoverification, and that gave everyone a geospatial awareness of resources. They could look at the situation on a map instead of on sheets of paper with data that may not be authoritative or accurate. Geolocation gave us that accuracy so we could properly locate each bit of reported data. By using the automatic geolocation of Survey123, everyone on the downstream side of the data could agree about where things were happening.

Q: How did you share the collected data?
A: We used the web app we built with the Web AppBuilder for ArcGIS dashboard template. The survey information collected with Survey123 fed data to the web app, which we called the Commander’s Viewer. This gave us the flexibility to show layers of information. Task force leaders had a view of their individual task forces. High-level people could access a survey snapshot with graphs to break down levels of impact assessment. We had a relocation survey for hospital patients, showing methods of transport and how many people were still waiting for transport.
Q: Aside from disaster response, what are you working on at IAFC?
A: We are trying to create a National Public Safety GIS Viewer. We’re a nation of 35,000 fire departments, and we do things 35,000 different ways. We are trying to come up with some national standards so we have consistency in response and decision-making. We want better real-time data and better service for citizens. We want to assist fire chiefs to ensure they have all the information they need to send the right resources to the right job and provide the fastest, safest, most appropriate response. We have been talking about building national standards on data collection for emergency services. The IAFC and NAPSG have been setting the stage to develop these standards. We have stood up an account with 1,000 named users to share with fire departments to collect data in the field and add it to national maps. We want to build national data layers, such as hydrants, target hazards, and infrastructure in the United States, that would be available during mutual aid events. We are currently using Survey123 to collect information on fire departments, fire stations, and fire resources to make a data layer for our new National Mutual Aid System. Mutual aid is how we move resources from one jurisdiction to another to help with an emergency situation.

