A few years ago, Farmers Telephone Cooperative (FTC), which has provided South Carolina with telecommunications services for more than 60 years, began offering customers faster Internet and voice services by connecting them to fiber-optic cables where available. Because FTC has a 3,000-square-mile (4,830-square-kilometer) service territory in five counties, it needed a simple way to keep track of where it was installing fiber to the home (FTTH) and where it could expand this service. GIS was the incontrovertible answer.

Getting Rid of Redundant Data
Prior to 2007, FTC operated for nearly nine years on a computer-aided design (CAD) system. Designers who draft telecommunications networks would extract the data they needed from a master record and work in individual CAD files. They could not transfer their work back to the master file, though, because there was a danger of overwriting someone else’s work. So the designers sent their work to a drafter who re-entered the data into the living master CAD file.
“There was redundant data everywhere,” said FTC’s plant design supervisor, Mark Brown.
Around the same time, telecommunications business began soaring. There was more competition and pressure to operate on tighter budgets, as well as more data than ever.
“We needed a more robust software to manage it,” said Brown. “Our old CAD system was great, but each exchange was its own file, and we were limited [to] one user at a time.”
In 2007, FTC switched to using Esri and Enghouse software to manage its data in GIS—and never looked back.
Strengthening Data Records
Strong business decisions start with the data, Brown said. Strengthening FTC’s data records—and maintaining them—became his primary goal.
“You don’t know what you need until you know what you have,” he said. “The best way to waste money and appear incompetent is to build a cable you do not need, or to realize once you have finished [that] there was a spare duct available.”
FTC contracted a local engineering company to record more than 70,000 GPS points of “anything you could see above ground,” said Brown. It located offices, utility poles, pedestals (which house different types of telecommunications equipment), and more, with subcentimeter accuracy. FTC then matched these points to its existing CAD data and brought everything into the new GIS.
Mapping a Five-Year Project in One Day
In 2012, FTC launched a five-year plan to expand its fiber network.
New fiber designs were becoming much more complex. FTC not only had to take into account the existing fiber, it also had to plan for future needs such as additional backbone cabling (the foundation of a telecommunications network) and sturdier network designs that could support more users and data.
The company assigned Brown and his department to come up with a strategy for its largest-ever FTTH rollout. Management’s directions were simple: hit the highest-density service areas first—the higher the customer concentration, the more sales.
The data that Brown and his team had spent years gathering was ready.
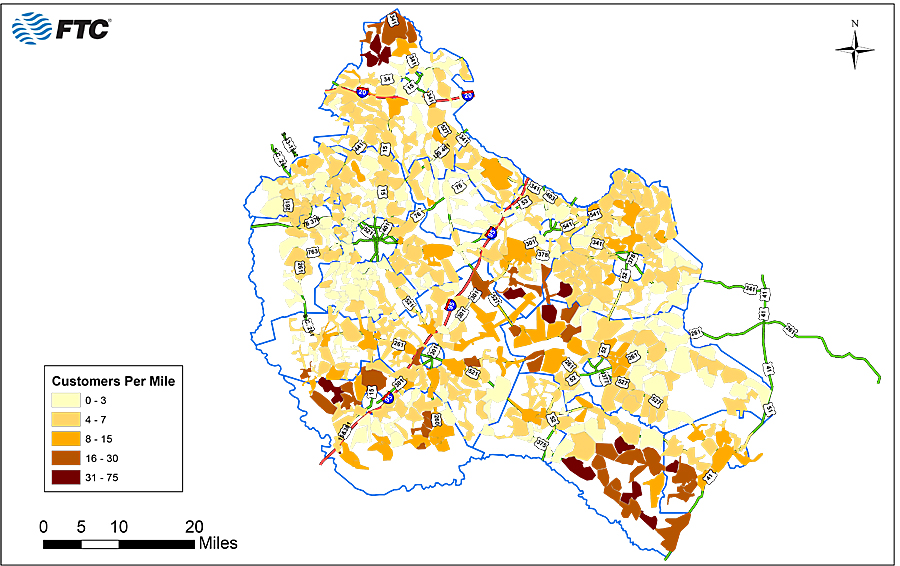
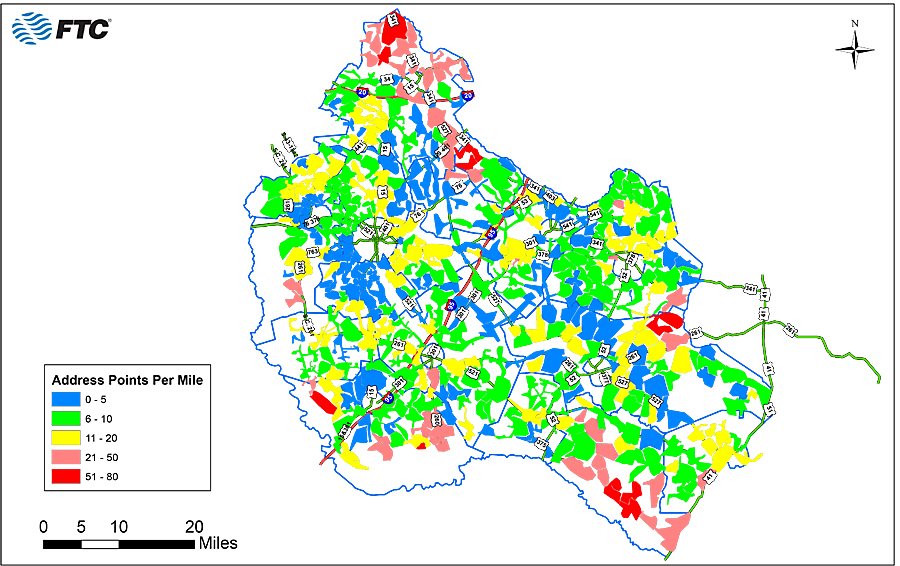
Brown got address point records from FTC’s various counties and joined them to existing polygons that show where copper-wire networks are. Within minutes, he could see where FTC’s customers were and where they weren’t.
“We quickly had really detailed maps that color-coded the whole service area from light to dark, based on concentration,” Brown said.

FTC used the Esri Field Calculator tool, which lets users perform simple or advanced calculations on existing records, to tally all the customers and address points in each square mile. With this, Brown could see where FTC should prioritize its fiber rollout.
“In less than three hours, I had chosen the areas we were going to build for five years,” said Brown. “These areas would have been impossible to identify and prioritize in a timely manner with our current staff,” he continued. “The design and drafting department was given a perfect opportunity to show management what their investment could now accomplish. Esri and its native ability to handle, sort, and display large amounts of data had proved itself as a sound investment.”
While executing the detailed design work for the project still took time, having initially identified the areas to focus on using GIS made FTC’s more granular construction design efforts more efficient.
“If you had to develop this plan in a CAD environment, it would have taken at least six months,” Brown said.
Marketing Fiber with Ease
FTC builds roughly 200 miles of fiber per year. Then the cooperative has to sell it.
Using GIS in its marketing and customer service departments has helped FTC cut down on a lot of the legwork that goes into publicizing new services.
The organization’s marketing team targets priority FTTH areas with GIS-based direct mail campaigns. It sends flyers to geospatially targeted residents to let them know not just about the work going on but also that once it’s completed, they will have more telecommunications services available. FTC sends a second flyer once the services are up and running.
Moreover, when customers call to inquire about whether fiber is available to them, customer service representatives have answers at their fingertips. FTC built an in-house map that runs on ArcGIS for Server. Customer service representatives use it to find out quickly if a customer can or will soon be able to have fiber or if fiber has not yet been planned for that area.
Additional Advantages
Brown views his organization’s FTTH project as just one example of a GIS paying for itself over time. Another is workforce maintenance.
During the past several years, a few members of FTC’s GIS team have retired. But the team has not skipped a beat. What in 2007 was an 11-person department now operates with only six people, including Brown.
“And even though we have a lot [fewer] people, we are accomplishing more work than we ever have,” he said.
That is thanks to GIS.
Learn more about Esri for telecommunications.

