As a leading sustainable energy company composed of eight electric and natural gas utilities in the northeastern United States, Avangrid needed to standardize and streamline workflows among its operating companies. So in January 2023, Avangrid implemented ArcGIS Utility Network at two of its natural gas operating companies, Berkshire Gas Company and Southern Connecticut Gas Company—the last two Avangrid companies to apply GIS to their operations.
This was the first step in a larger initiative to standardize business systems and processes across the organization and enable Avangrid to work as one company. With all six of its natural gas operating companies now using ArcGIS technology, Avangrid has embarked on the next phase of standardizing strategic business processes: developing and implementing a common natural gas leak survey solution using ArcGIS Workforce, ArcGIS Field Maps, and ArcGIS Dashboards.
Working with Esri partner UDC, a GIS-centric systems integrator for utilities and infrastructure companies, Avangrid has built a fully digital and connected workflow solution with granular, location-based regulatory compliance reporting capabilities.
Streamlining Reporting
Previously, each of Avangrid’s natural gas operating companies had its own leak survey processes and methods, making it difficult to ensure consistency and efficiency. The new digital solution aimed to eliminate paper workflows and streamline reporting. It also needed to meet increasingly rigorous regulatory reporting requirements, including requests for documented processes, digital records with time stamps, spatial records of work performed, data reporting at a more granular level, and historical recordkeeping.
When the team at Avangrid started looking for leak survey solutions, it wanted something out-of-the-box that wouldn’t require customization or a lot of internal support resources. The team needed the solution to be configurable, though, so that it could handle more than 10 regulatory leak survey programs that each dealt with unique equipment and reporting requirements that vary by state. Other essentials for the solution included the ability to do the following:
- Assign work spatially
- Send work assignment notifications to mobile crews
- Use a field-based app that connects to GPS devices, incorporates breadcrumb tracking, and allows mobile crews to perform their work and collect data in ways that correspond with regulatory reporting requirements
- Notify office-based employees when fieldwork is completed and allow them to verify it
- Create accurate reports
- Generate multiple dashboards to support different users’ needs
Staff at UDC documented these requirements, developed the solution architecture, and deployed Esri’s out-of-the-box tools. For the initial phase of the project, the team tackled three survey types with varying compliance cycles and some state-specific requirements: main leak surveys done in vehicles, main leak surveys completed while walking, and service leak surveys carried out while walking.
Three Apps, One Solution
The three-pronged solution that resulted from this work relies on ArcGIS Workforce to manage scheduling for mobile employees; ArcGIS Field Maps for mobile employees to use to complete their field assignments; and dashboards built with ArcGIS Dashboards to track crews, work assignments, and the status of compliance requirements.
ArcGIS Workforce
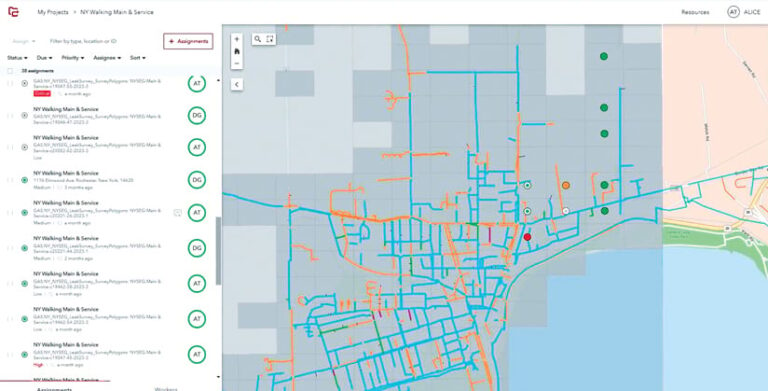
To efficiently schedule work and assign crews, Workforce shows the work that needs to be done on a map, leveraging the company’s major and minor grids to create appropriately sized workloads. The app records and displays employees’ locations and work progress, with real-time location and tracking enabled via Field Maps and GPS.
Using Workforce, dispatchers can view all work assignments, their progress, and which tasks have been completed. Dispatchers can assign work to employees based on the type of assignment it is, its priority, the date the assignment is due, its work order ID, and a description of the work. Once a task is assigned to someone, it is sent to the team member’s tablet. Mobile crews then use Workforce in the field to access their projects. Their to-do list helps them track their assignments.
ArcGIS Field Maps
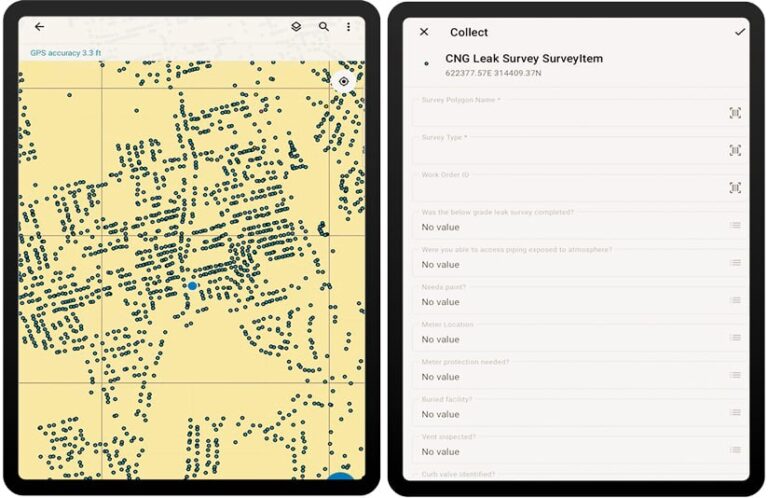
When a mobile crew member begins an assignment, the dispatcher can see that in Workforce. After choosing Start in Workforce, the crew member then selects Open in Field Maps, and Field Maps launches automatically on the person’s tablet.
The crew member uses the app to complete their assignment by first entering information about each piece of equipment, including the device type, its serial number, and basic details about it. They can then start GPS tracking within Field Maps to use breadcrumbs to document the inspection. If they come across a natural gas leak, they use the configured digital form in Field Maps to grade it and assign it a work order ID. If a mobile crew member encounters any abnormal operating conditions during the leak detection process, they can record them using another standardized form in Field Maps.
Once the mobile crew member finishes the assignment, Workforce records the project’s completion and notifies the dispatcher. And if the crew member had to complete some or all of the work offline, everything they recorded in Field Maps automatically gets reported back to the dispatcher once a connection to Wi-Fi or cell service is reestablished.
ArcGIS Dashboards
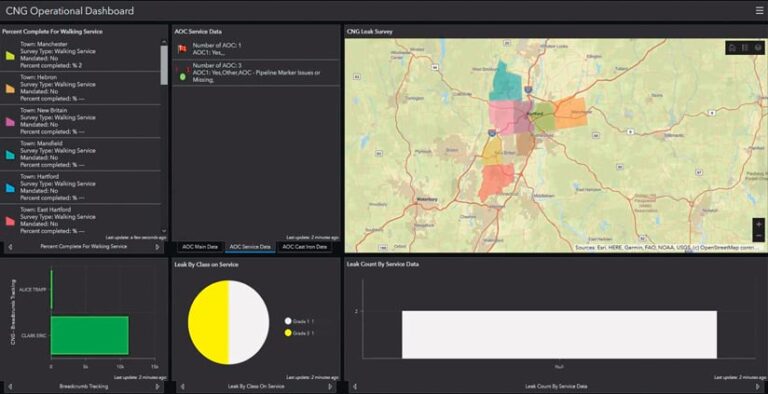
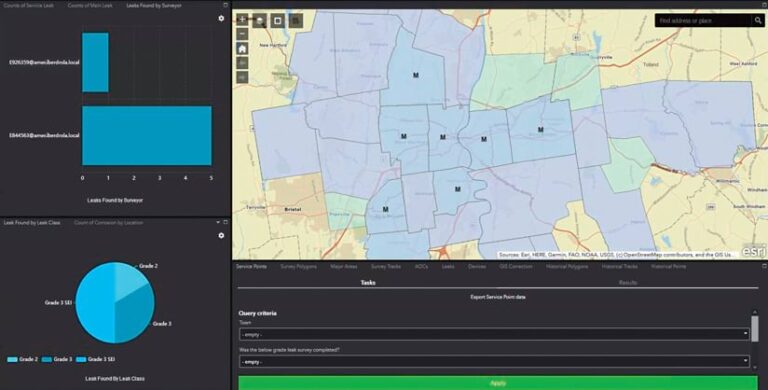
The dashboards that the UDC team built using ArcGIS Dashboards enable utility employees to see historical leak analyses, daily tracking of crew members, and regulatory reporting and compliance information. An operational dashboard shows completed work assignments with real-time tracking of the completion percentage.
Compliance managers can monitor abnormal operating conditions and leaks, which is a regulatory requirement, and observe any deficiencies in equipment or use of breadcrumb tracking. This functionality and level of information reporting was difficult, if not impossible, for the utilities to achieve with their previous leak survey methods. Once a survey’s reporting cycle is complete, data is moved to a historical dataset that can be reviewed in a separate dashboard view.
Unified Operations
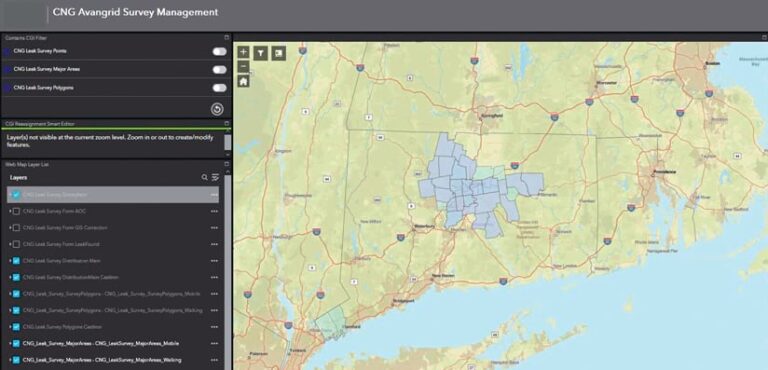
Following successful proof-of-concept implementations at Berkshire Gas Company and Southern Connecticut Gas Company, Avangrid has now rolled out the leak survey solution to Connecticut Natural Gas, New York State Electric & Gas, and Rochester Gas and Electric. At the operating companies where ArcGIS Utility Network is in use, the solution integrates the ArcGIS Utility Network model. The companies that have not yet shifted to Utility Network currently rely on the geometric network model.
The integration of ArcGIS technology into the utilities’ compliance management workflows for leak surveys is helping Avangrid achieve its goal of unifying operations. The solution meets all of Avangrid’s requirements and offers multiple benefits, including the following:
- It standardizes data collection and leak survey management methods and workflows across operating companies.
- It streamlines mobile work assignments and survey data collection.
- It improves leak survey tracking, proactive asset maintenance, data accuracy, the ability to meet compliance deadlines, and the information reported to regulators.
- It provides access to historical leak surveys, enabling operating companies to perform analyses to improve processes and support capital investment decision-making.
“Having a mobile device- and digitally enabled solution has been a big improvement for users over paper maps and forms,” said Keith Anderson, GIS mapping and records supervisor for Connecticut Natural Gas. The solution, he said, boosts “the organization that is required to maintain regulatory reporting standards.”
Avangrid’s next steps include exploring how to integrate the solution with SAP’s enterprise resource planning software, expanding it to incorporate more survey types, and introducing it to additional operating companies.

