Companion “Collector” App Supports Real-Time Field Data Capture
Operations managers, planning and logistics specialists, and incident commanders frequently rely on the real-time flow of information to get the knowledge they need to make timely and more informed decisions. Two new ArcGIS offerings—Operations Dashboard for ArcGIS and Collector for ArcGIS—help them better monitor services, people, deliveries, vehicles, and more, while staff members simultaneously report critical information from the field.

A Common Operating Picture Visible across the Organization
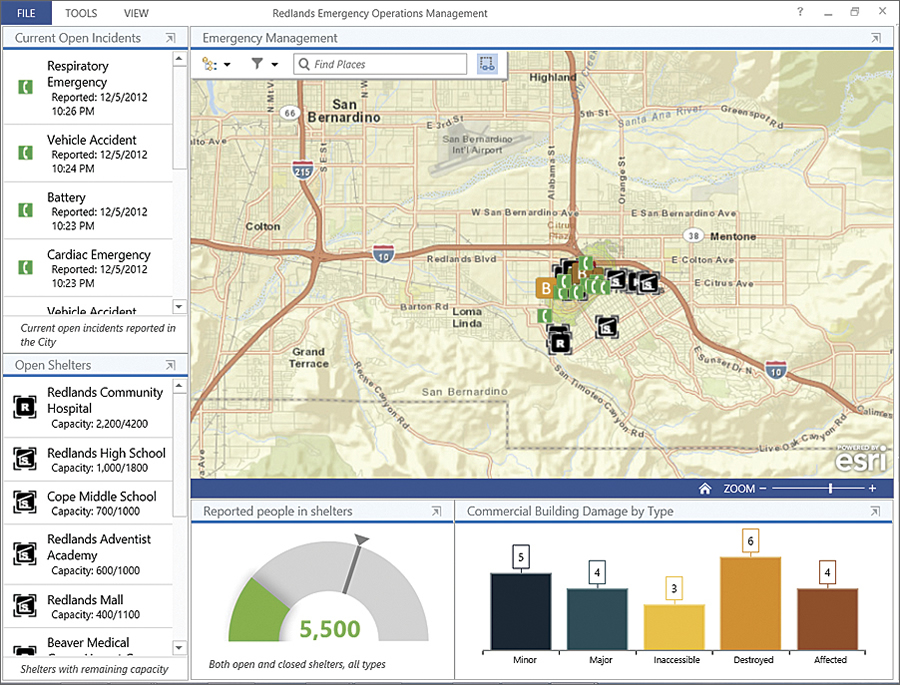
Operations Dashboard for ArcGIS is a new Windows application that provides real-time access to information to allow the monitoring and managing of activities and events, tracking field personnel, and assessing daily operations within an organization. It integrates interactive maps and a variety of data sources to create operational views, including bar charts, lists, histograms, gauges, and other performance indicators based on live geographic data defined in a web map or web service.
Planners, decision makers, and operations managers can use Operations Dashboard to better monitor ongoing activities and focus on the aspects of the operation that matter most to them. For example, a public safety dashboard can be easily configured to monitor the number of open incidents sorted by type or report time and highlight the most recent incidents at the top of the list. Likewise, an assessor’s dashboard may highlight neighborhood changes in assessed value and tax revenue, providing the most recent appeal, foreclosure, and sales information. This helps users see specific patterns and answer questions, such as Which type of incident is being reported most often, and where is it occurring most frequently? or What impact do sales and foreclosures have on year-to-year property values?
Operations Dashboard was designed for Windows desktops to create and manage focused views of real-time information that can be used and shared across an organization. In a typical operations center, Operations Dashboard takes full advantage of multiscreen workstations and large-scale monitors to allow visualization of and response collaboration on a specific system or event. For decision makers who are on the go, information can also be accessed using Operations Dashboard on Windows tablets.
Because Operations Dashboard is powered by ArcGIS Runtime SDK for WPF, developers can extend it by creating custom widgets and map tools that provide additional context and capabilities for monitoring and managing operations.

Improved Field Productivity
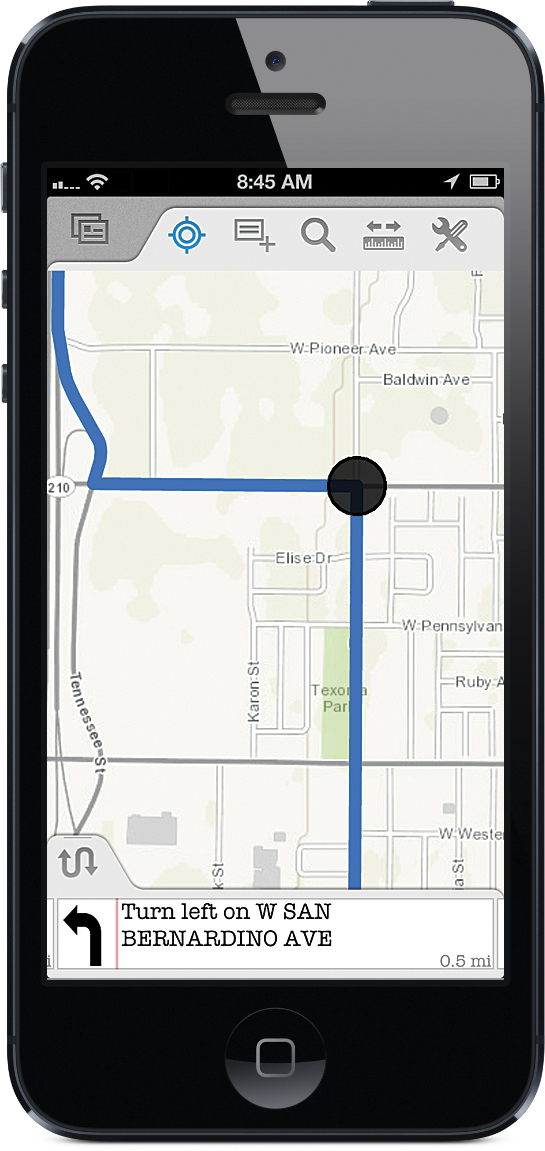
Information displayed in Operations Dashboard can come from staff gathering critical data in the field, such as field crews performing a damage assessment. Collector for ArcGIS, designed for iOS and Android smartphones, is a new native application to improve the accuracy and currency of spatial data. It is a companion to Operations Dashboard but can also be used in a stand-alone environment. Field crews can download maps using Collector and then capture spatial or tabular data, attach photos and video, plan routes, and get directions. Information can be transmitted and immediately displayed in Operations Dashboard and shared throughout the organization in real time.
Real-Time GIS in Action
How would Operations Dashboard and Collector work in a live emergency situation, such as a large earthquake that hits a major community?
The operations manager at a government Emergency Operations Center (EOC) can configure Operations Dashboard so that it maps the locations of fire trucks, law enforcement vehicles, and ambulances. It can also report traffic accidents and medical calls. A 911 call reporting that students and teachers are trapped inside an elementary school can be pinpointed on a map, along with information about the incident, such as the date, time, and the conditions of those wounded.
The EOC staff can consult the map, see the location of the closest paramedics, and immediately send the nearest available crew to the scene. Paramedics using Collector can then provide updates about the conditions of the students and their teachers. That information could automatically appear on the map or in a list on Operations Dashboard.
Field-workers assessing earthquake damage to the school can gather and report that information using Collector. Damage assessments can then be immediately sent to a municipal agency and appear on its Operations Dashboard app and be integrated into the city’s GIS.
Download and Get Started
Operations Dashboard is available for use on Windows desktops and Intel-based Windows 7 and 8 tablets. It includes messaging integration via an Extensible Messaging and Processing Protocol (XMPP) hosting server, such as Microsoft Lync. Microsoft .NET 4.5 Framework is required before downloading Operations Dashboard from ArcGIS.com.
Collector can be downloaded directly from the Apple App Store and Google Play. Operations Dashboard for ArcGIS and Collector for ArcGIS are freely available, but users need an ArcGIS Online account to leverage their full capabilities.
For more information, visit esri.com/dashboard and esri.com/collector.
Related Video
Using the Operations Dashboard for ArcGIS and Collector for ArcGIS Applications
Esri staff demonstrate how these applications can support your daily operations.

