In a city, each space affects and reflects the function of every other. The size and shape of each building, parking structure, and green space, taken together, make up the physical form of the city—for better and for worse.
Over the last half century, urban development has tended toward tall glass buildings and wide roads that accommodate lots of cars, with little regard for walkability or more equitable mobility options. But if we look at the kinds of cities that most people seem to want to live in today, we often see that they devote very little space to road transportation and instead center on useful destinations like shops and cafés that people can easily walk or bike to.
To directly take on these challenges, urban designers must take geospatial context into consideration when formulating development plans. That’s where ArcGIS Urban comes in. The web-based 3D modeling software enables users to sketch out various design scenarios, model buildings, and measure the performance of their plans by using interactive metrics.

City planners in Uppsala, the fourth-largest and fastest-growing city in Sweden, are using Urban, for example, to design a new district with 33,000 new housing units that will accommodate 50,000 new residents by 2050. The planners wanted to concentrate on sustainability while maintaining the quality of life that current residents of the centuries-old university town already enjoy. With ArcGIS Urban, city planners were able to test different design strategies for the project and run them against sustainability and quality-of-life metrics to ensure that the development wouldn’t subtract from the area’s existing biodiversity and would still enable the city to meet its goals for reducing carbon emissions.
On the other side of the world, the City of Des Moines, Iowa, is employing ArcGIS Urban to transform its historic East Village into a more walkable, dense, mixed-use neighborhood. When a local property developer floated the idea of building a new 40-acre market district, the city’s planning and economic development teams wanted to visualize the prospective space to ensure that views of the gold-domed state capitol would be preserved. They built a digital twin of the area and, using the technology, were able to balance the desire for urban development and renewal with their responsibility to protect historic views, meet housing demands, and ensure livability and climate resilience in the area.
The summer 2021 release of ArcGIS Urban contains an assortment of new tools that can help urban planners meet their challenging design goals while giving them a smooth user experience. Read on to find out more about several of these advancements.
More Flexibility When Sketching Buildings
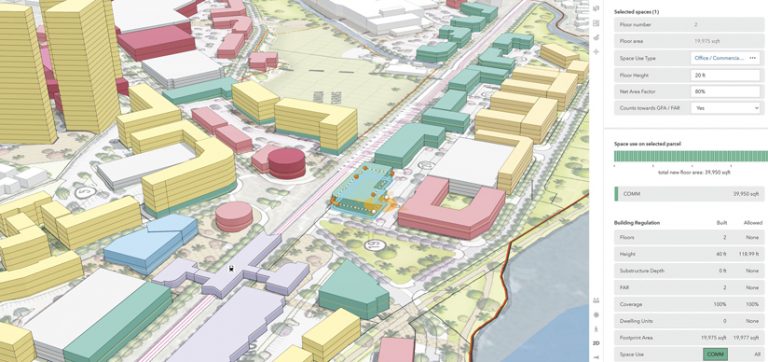
Buildings and space use types, which describe the function of a space within a building, are the centerpiece of any design scenario within an urban plan. Now, in ArcGIS Urban, users can modify buildings that have been procedurally generated and sketch buildings from scratch on a selected parcel by drawing a new space use. This opens up a world of possibilities when creating detailed site concepts. For instance, when drawing from scratch, users can demolish specific buildings, if desired, and then draw one or more buildings on the site, starting with the first floor. They can then easily add floors and incorporate other space uses into the building.

This new sketching capability also allows users to edit individual vertices of building floors, push and pull building walls, rotate building parts, and adjust the elevation of the entire structure. And support for snapping has been added throughout Urban, so users can snap new details to existing elements, making editing easier. In addition, it is now possible to adjust various attributes—such as the space use type, the height, and the net area of an individual building floor—on the fly. This means that for complex buildings, each floor can have unique parameters without requiring users to make a bunch of new space use types.
Metrics for Real-Time Feedback on Goals
Previously, there was often a lag between the time designers created new urban scenarios and analysts evaluated them. But now, ArcGIS Urban makes the design formulation and evaluation processes seamless. As planners create new scenarios, they can use the technology to analyze the effects of their designs, including things like the financial performance of the plan; the overall distribution of housing units by type; and sustainability forecasts, such as how much the plan will reduce carbon emissions.
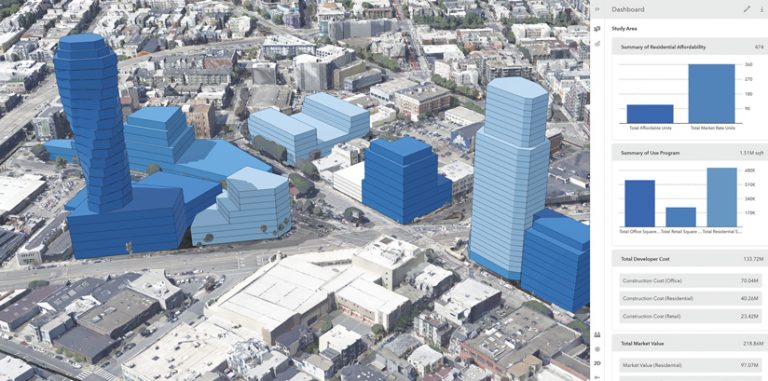
This is possible, thanks to a new capability in Urban: custom metrics. Users can now create their own metrics to report on objectives such as the total number of jobs a project will generate, how affordable a residential development will be, and parking supply and demand. Metrics can also be configured based on other metrics. For example, designers can simultaneously evaluate how many affordable housing units a residential development will contain and how many market-rate units it will have by dividing the total square footage of the development accordingly.

As users create their designs, they can always keep track of how their metrics relate to one another by using a dependency graph. A metrics dashboard allows users to report and visualize metric values in an easy-to-understand way across all planning scenarios. And the dashboard is interactive, giving users the ability to visually assess things like how much a building floor or surface will contribute to a particular metric. By clicking on charts related to parking, for instance, planners can see where demand is highest throughout the proposal and compare that to where available parking will be located.
Collaboration Gets a Boost
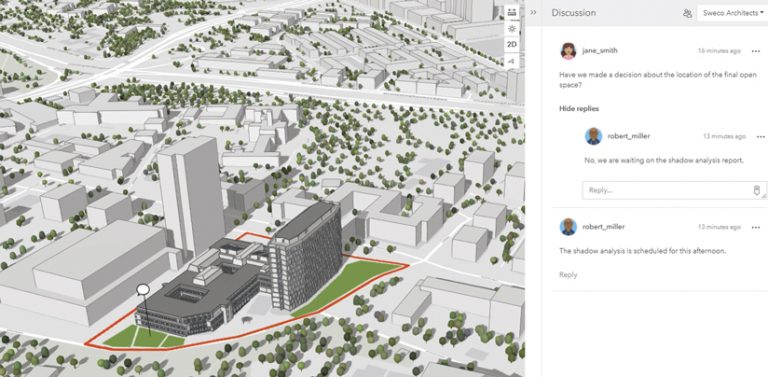
To make it easier for collaborators to exchange ideas about various planning scenarios, ArcGIS Urban has a new sharing and discussion functionality. Users can decide whom they want to share their designs with and then set up individual discussion channels in Urban for each group of stakeholders. People can make comments about the scenarios either by writing general notes or by annotating specific parts of the designs.
Of course, Urban users can still email their colleagues links to their design plans, and discussions can certainly happen outside the software. But this new commenting capability makes it easy to add fresh ideas to a plan, reply directly to comments made on a design, and evaluate various scenarios in detail and in context.
How to Get Started
This is just a sample of the new features available in ArcGIS Urban. Learn more about how to sketch new buildings, create metrics, conduct interactive shadow analyses, and more.

