For hundreds of years, mariners have used paper nautical charts to steer their vessels near coastlines, through varying water depths, and around navigational hazards. Now, new technology and technological requirements are changing the landscape—or seascape, if you will—around chart production. Hydrographic offices are starting to move away from the idea that they have to make traditional paper nautical charts and more toward the notion that mariners need—and want—updated navigation charts on demand.
“Paper charts are typically very labor-intensive and time-consuming to build, so they can lag behind electronic charts in terms of getting information out quickly,” said Craig Greene, product manager for ArcGIS Maritime at Esri.
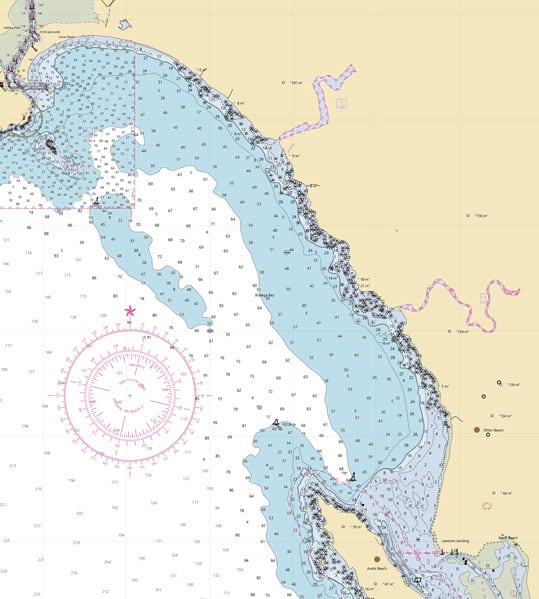
“A new paper chart used to come out two years after the data for that chart became available,” said Guy Noll, maritime consultant at Esri. “And it’s been like that for decades.”
Lots of mariners still like the look, feel, and function of traditional paper charts, though. So while this doesn’t mean that paper charts are going away, it does mean that the way they’re made is changing.
Chart production is becoming an electronic-first endeavor, where all the data is pulled from one standardized, GIS-based system. From there, mariners can access charts on electronic navigation or mobile devices, or as PDFs that can be printed out. The information on the charts will be timelier and more accurate, and in some parts of the world, mariners will be able to tailor their charts to exactly where they’ll be piloting their vessels.
“This is completely turning on its head how traditional paper charts are made,” said Greene. “These charts are still going to be safe for navigation, but they’re going to look different. It’s a big change.”
And it’s where the industry, by and large, is heading.
Time to Streamline
The National Oceanic and Atmospheric Administration (NOAA) Office of Coast Survey is at the forefront of this transition. In late 2019, the office informed mariners that, within five years, it would wind down its production of traditional paper and raster nautical charts and replace them with a web app that would allow anyone to make a chart using the most up-to-date Electronic Navigational Chart (ENC) data from NOAA.
The NOAA Custom Chart app, which is still a prototype, is being built in close collaboration with Esri using ArcGIS Maritime, an extension for ArcGIS Desktop and ArcGIS Enterprise that streamlines and accelerates nautical chart production.
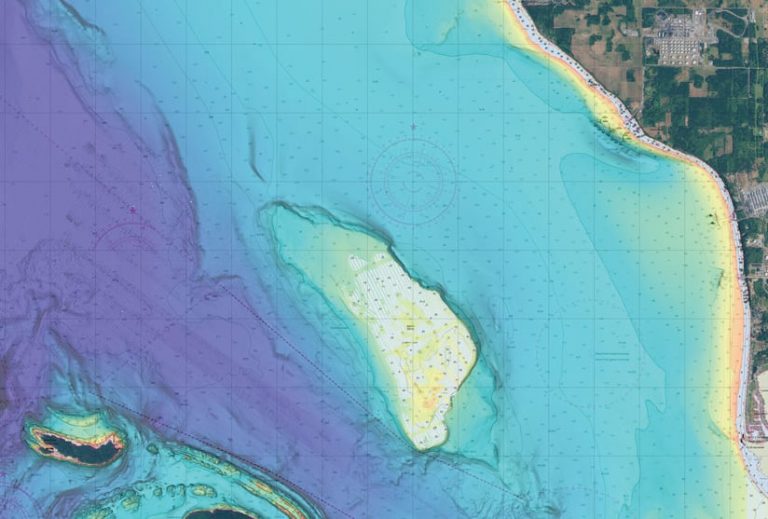
“We meet on a regular basis with NOAA and the team that manages the NOAA Custom Chart app,” said Greene. “We’re working alongside them to implement things that will lead people to adopt the app so NOAA can eliminate paper chart production by January 2025.”
The reasons the Office of Coast Survey wants to stop producing paper charts are twofold, according to Craig Winn, the portfolio manager for high-density (HD) charting in the office’s Marine Chart Division.
“The industry is relying more heavily on Electronic Navigational Charts for navigation and planning, so paper has been moving into a backup role,” he said.
And for far too long, the Office of Coast Survey has been supporting two separate workflows: making the ENCs, which consist of vector data, and making the raster charts, which are currently used to produce paper products. This puts a lot of demand on time and resources.
“Those are distinct workflows requiring distinct personnel who use different pieces of software,” Winn said.
This isn’t just a problem for the Office of Coast Survey, either. The Canadian Hydrographic Service (CHS) is facing similar difficulties.
“Right now, CHS needs to support full synchronicity between three product lines: ENC, raster, and paper,” said Louis Maltais, director of navigation geospatial services and support at CHS. “And on top of these three things, I need to maintain the updating system for the ENC, the updating system for the raster, and the updating system for the paper. It’s a nightmare to maintain.”
Which is why Canada, too, is looking for ways to streamline, accelerate, and even automate paper chart production.
“We need to have the portfolio be as agile as possible,” said Maltais.
Winn echoed this sentiment. “At the Marine Chart Division, we see this as an opportunity to devote our efforts to maintaining the ENCs and then being able to support other products from that dataset,” he said.
A Shift to Data Maintenance
The maritime industry started veering toward electronic-first navigation in 2009, when the International Maritime Organization (IMO) required all merchant ships to use an Electronic Chart Display and Information System (ECDIS) to comply with chapter V of the International Convention for the Safety of Life at Sea, an international maritime treaty.
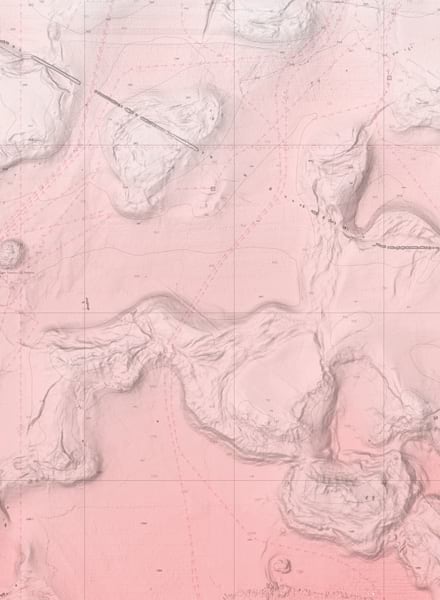
“Most hydrographic offices are structured around building traditional paper nautical charts. They spend a lot of their time, money, and energy on those,” Greene explained. “And with that mandate from the IMO, coupled with increased reliance on modern electronic systems, paper charts are essentially becoming the backup.”
There is still a place for paper charts, however, especially if a ship’s electronic system fails—which happens more often than most people think, according to Maltais.
“Hydrographic offices still need to produce them,” said Greene, “but they can’t afford to have their entire organization built around making traditional cartographic paper products.”
So the focus is shifting to curating and maintaining the vector data used to make ENCs rather than designing paper charts. This will also help the maritime industry more robustly embrace new international data standards, including the S-100 universal hydrographic data model and the S-101, the new product specification for ENCs. Both of these, along with the S-57 data standard—what’s currently used for ENC production—also contribute to building what’s known as a Marine Spatial Data Infrastructure (MSDI), which will help agencies all over the world share hydrographic data and services at national and regional levels.
“With an MSDI, countries can use the content they’ve already created to enable a future where their manual work can add repeatable value rather than product-by-product value,” said Noll. “They can set up the pattern, automate that pattern, and then focus on the data rather than trying to create the pretty-picture products of the past, which took a lot of time per product.”
Charts on Demand
With all these changes rolling in, the maritime team at Esri wanted to come up with a solution.
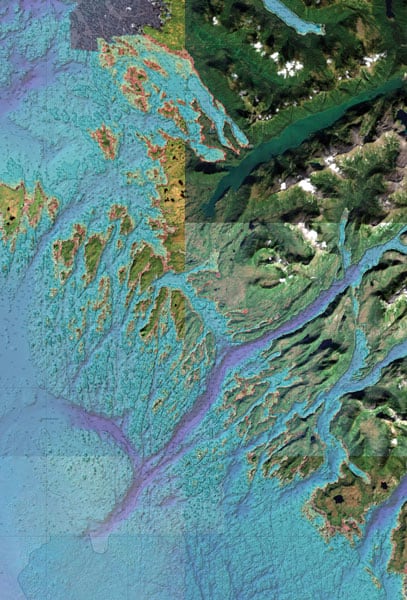
“Products on Demand [PoD] was essentially our response to this,” said Greene. “We thought, well, look at what modern technology can do. We can make a web app that can automatically generate a PDF—a paper chart—directly from the electronic chart data.”
It was a cutting-edge idea, and NOAA’s Office of Coast Survey quickly came aboard. Already a longtime user of ArcGIS Maritime, the office would employ the ArcGIS Maritime server extension as it always had—to generate REST or web map services directly from its electronic chart data. But instead of having its ENCs reflect paper charts, which had been done for decades, the Marine Chart Division would flip it so paper charts come from ENCs. That’s where the Products on Demand functionality of ArcGIS Maritime adds value.
“ENCs are essentially attributed data—features and attributes—and we have a central database solution for making them,” explained Winn. “We go in and make whatever changes we need to make to our central database, and then we push those changes out through ArcGIS Maritime. These changes are exported as updated ENCs. Versions of those ENCs are placed in the same server location as the web application, and then the tools that Esri has developed extract the information from those files and present it to users for them to make their own PDFs, which they can print somewhere if they need to.”
Having all the data in a central database makes ENCs more uniform; more accurate, since new data can be added quickly; and more accessible than traditional paper charts.
Helping Mariners Make the Switch
The challenge now is to get mariners to use either ENCs or these new paper charts that are based on ENCs.
Although CHS is still in the exploratory phase of implementing a solution that will streamline its paper charts and ENCs, the organization is already trying to gauge how readily Canadian mariners will take to something like this.
“They’re telling us that there are two things they like about the paper charts,” said Maltais. “They feel that, for planning purposes, it’s really good to have a wide view of where they’re going so they can plan their routes. And they want to have the paper chart somewhere as a backup, to make them feel safe.”
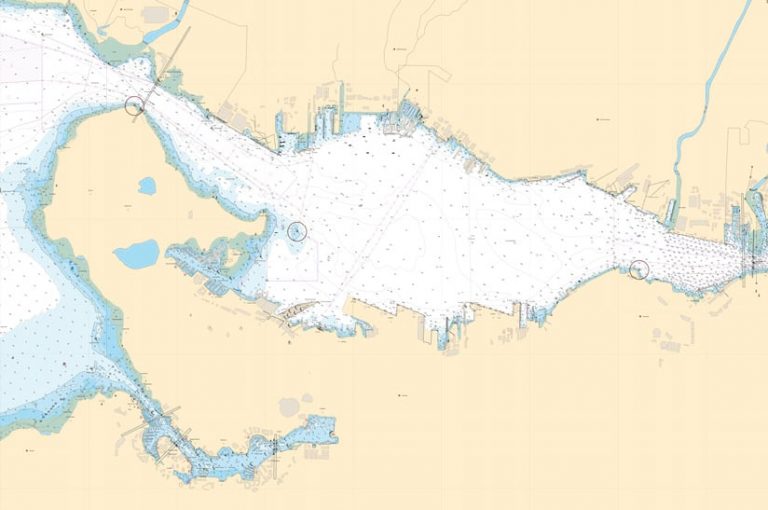
But the future is electronic charts, as Maltais emphasized. So one idea he has for what he calls paper charts 2.0 is to have mariners subscribe to a service.
“This is where we’re going in Canada in terms of our S-100 suite of services,” said Maltais. “You will subscribe to a service, and once you connect to that service, you don’t need to worry if you’re up-to-date or not. You’re connected to the service, so you’re always going to be up-to-date.”
NOAA’s Marine Chart Division is taking similar mariner concerns into consideration, though it’s moving more quickly to sunset traditional paper chart production and cancel old paper charts altogether. But the agency is being careful.
“I want to be sure that when a chart gets canceled, equal or better digital data is available in that area,” said John Nyberg, chief of NOAA’s Marine Chart Division. “I want mariners to choose the ENC, not be forced to use it. If we’re providing better, more up-to-date data with more detail that’s easier to update, I hope they will choose to use it.”
The NOAA Custom Chart web app is showing promise at making charts on demand work in the United States, both for mariners and for the Office of Coast Survey.
“We see this being something that a lot of people will use, if not daily, then certainly on a regular basis to access static copies of our datasets—charts, essentially,” said Winn. “We’re not there yet, but once people get used to it and they’re using it, they may say, Why didn’t we do this 10 years ago?”
