The Vermont Agency of Transportation (VTrans) adopted a GIS-based mobile data collection system for its rail crossing inspections that cut the time required for inspections by 75 percent.
VTrans is fairly unique in that it owns and manages more than 600 miles of active rail lines and trails. It is responsible for maintaining 214 bridges, 401 crossings, and more than 1,000 culverts. To fulfill its mission to move goods and people safely and efficiently, VTrans recently modernized its railroad crossing inspections.
In the past, VTrans had used a “squeaky wheel” approach to addressing crossing maintenance concerns. According to Stephen Smith, GIS project supervisor, the public, the town, or the railroad would report areas that needed work, then Vermont would fix it.
That was the process until 2011. That year, Hurricane Irene was a huge wake-up call for the whole state. It caused hundreds of millions of dollars in damage to highways, rail, and bridges.
In response, GIS professionals from across the agency came together to produce maps for emergency responders that enabled them to prioritize work and respond quickly as new information came in. The rail section used GIS to track damage sites and provide maps and other information to the Federal Emergency Management Agency (FEMA). While VTrans had used GIS since the mid 1990s, it really came to the forefront during the emergency.
After the successful use of GIS in recovering from Hurricane Irene, the agency realized its rail section would benefit from having its own GIS team. After a successful six-month pilot, VTrans hired Smith in fall 2012 to focus exclusively on the GIS needs of the rail section.
Smith worked with the subject matter experts in the section to build a system that not only responded to emergencies but also better used the resources of a limited budget to target areas of high need. “With the spatial component in mind, we could clearly visualize our plan to management, executives, and the legislature,” Smith said.

Laptop Limitations
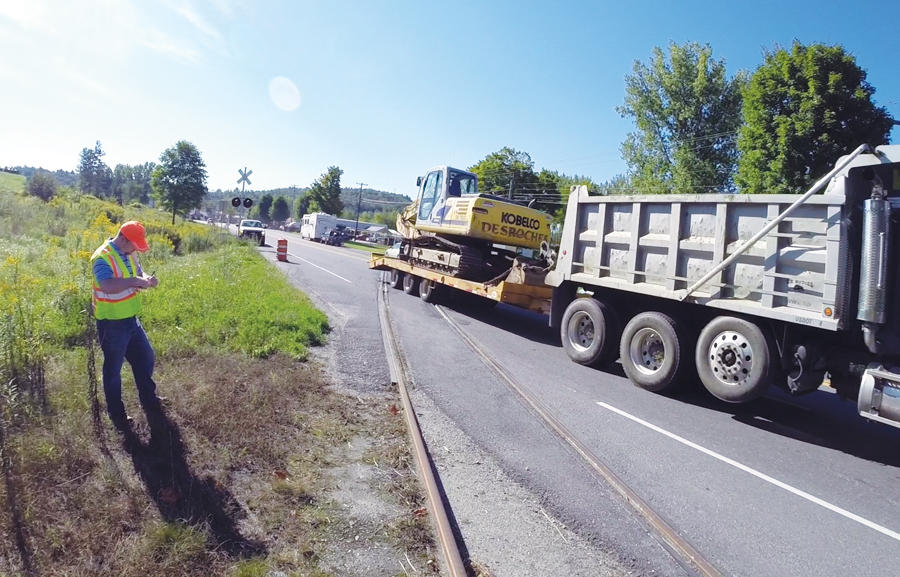
To collect and improve GIS data, VTrans hired a student intern, Aaron Wiener, from the University of Vermont. Wiener’s task was to identify and inspect all public, at-grade crossings. He used Federal Railroad Administration (FRA) crossing data, cross-referenced with Vermont’s listed inventory and other historic data. Over four months, Wiener collected information on 385 crossings using a combination of laptop-accessed spreadsheets, printed map screen shots, and a pen and notepad.
At active crossings, Wiener recorded signs, devices, surface materials, and additional notes in more than 30 spreadsheet columns on his laptop. He took pictures and manually uploaded them.
“Aaron did a great job,” Smith said. “But there was definitely some room for improving efficiency.” The process had drawbacks. Sometimes FRA data was out of date. In addition, Wiener could spend hours entering handwritten data and uploading photos using his laptop. To get from one crossing to the next, he cross-referenced the printed maps, so it took a long time to get to crossings.
Seventy-Five Percent Faster
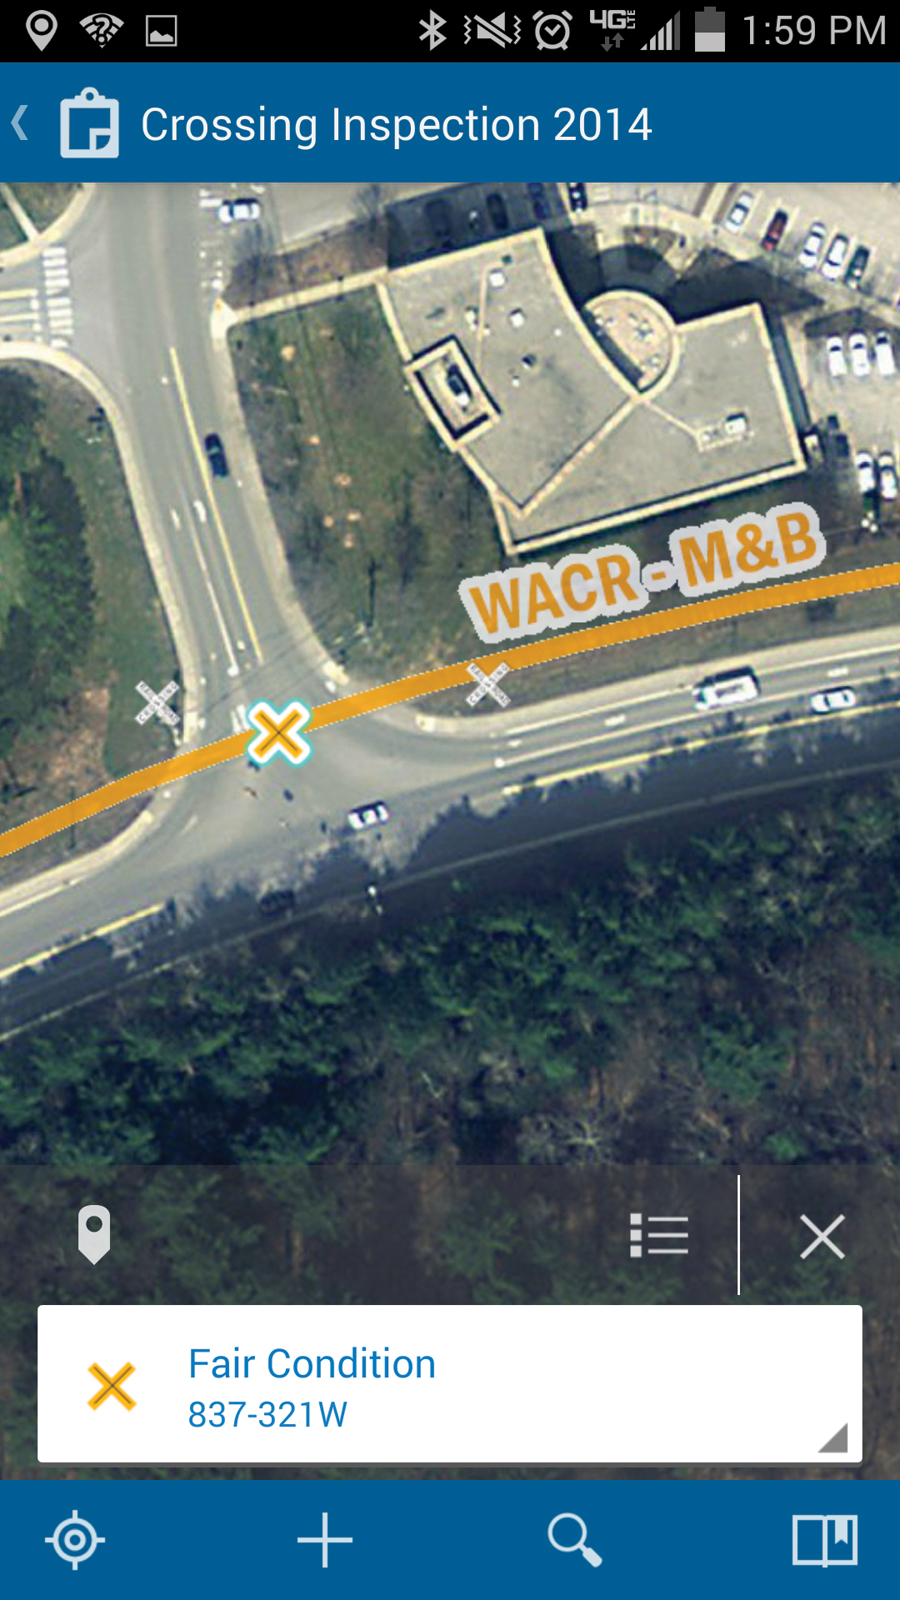
By the next summer, VTrans had found a faster method. In the spring, VTrans got some help from Esri transportation experts in configuring the Collector for ArcGIS app for mobile data collection.
Staff built a dataset with intuitive, readable field names (e.g., GateCount and SurfaceType) and domains. Data entry was optimized with as many drop-downs as possible to reduce the chance of collection error. Then they published these datasets as map and feature services through ArcGIS Online and VTrans secured ArcGIS for Server. Smith got support from the IT department at Vtrans for scripting and managing the server and database.
The result was a user-friendly data collection system that Wiener could use. When Wiener came back to help on the project, his laptop and notebook didn’t go with him into the field. With this system, Wiener’s smartphone displayed current rail property and asset information in easily consumed map viewers. With up-to-date asset data and a device that synced photos over Wi-Fi, he avoided the hassles of cross-referencing data, manually estimating the quickest inspection routes, and manually uploading photo files.
The new system also required less from Wiener physically. He no longer had to return to his car to pull out his laptop and enter data. “There was a comfort in knowing that rather than having to deal with all these bits and pieces of everything and trying to piece together these maps, I had it all right here. It was considerably easier,” Wiener said.

If Wiener had to move a crossing location, he could update the GIS with a few taps. “He had all of that extraneous work taken away,” Smith said. “The inspection time went from four months to four weeks.” Wiener stayed on for the rest of the summer to document his process by creating the first official Annual Grade Crossing Report, which summarized his findings.
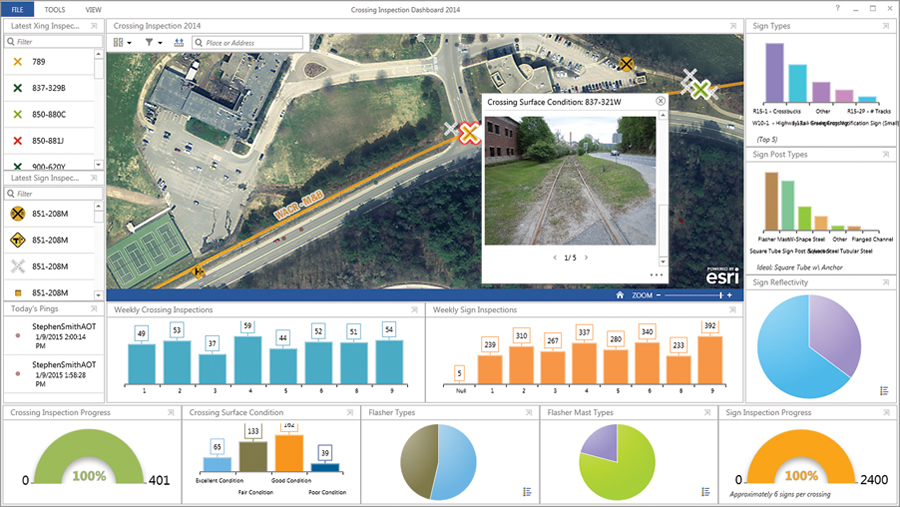
Previously, Smith had to wait months to get a spreadsheet report of Wiener’s work to review inspection findings. With Collector for ArcGIS feeding to an operations dashboard via ArcGIS Online, Smith could monitor Wiener’s progress in real time. “If I thought he missed a crossing along the road, I could send him a text,” Smith said. “It was sort of a live quality control.”
Smith could evaluate photos in real time too. If a crossing was in bad condition, he could reference data on an upcoming project to see if crews were already scheduled to work on those assets. If work wasn’t scheduled but the asset needed immediate service, he could put in a request. “We were able to address maintenance issues on the fly if we needed to,” Smith said.
Wiener completed approximately 92 crossings a week over a large geographic area. The results were also visible to the public and other VTrans personnel via convenient web maps. Rail crossing inspections not only met regulatory compliances, they were quick, easy, transparent, and completed with massive time savings without disrupting the familiar workflow.
Ground Transportation in the Cloud
Since its initial success switching to the cloud, the rail section has continued to leverage more features from Collector for ArcGIS and Operations Dashboard for ArcGIS. It has begun performing higher-level analyses of crossing conditions and added relevant widgets to track updates with graphs, gauges, bar charts, pie charts, and other ways to visualize statistics.
The inspection process was expanded by adding signs to the summer 2014 inspection. Data on more than 2,400 regulatory and advanced warning signs, including photos and condition information, was collected during the summer of 2014. Even though there were more thorough inspections, the process took just nine weeks.
The complete rail crossing inventory has informed the agency’s prioritization of maintenance, repair, and other improvement projects. For more information, contact Stephen Smith.

