Anyone who travels around the state of Maryland—whether by car, boat, bus, train, plane, bike, or even foot—relies on the Maryland Department of Transportation (MDOT). With that in mind, MDOT works to deliver safe, sustainable, and smart transportation solutions for its more than 6 million residents and 42 million visitors each year.
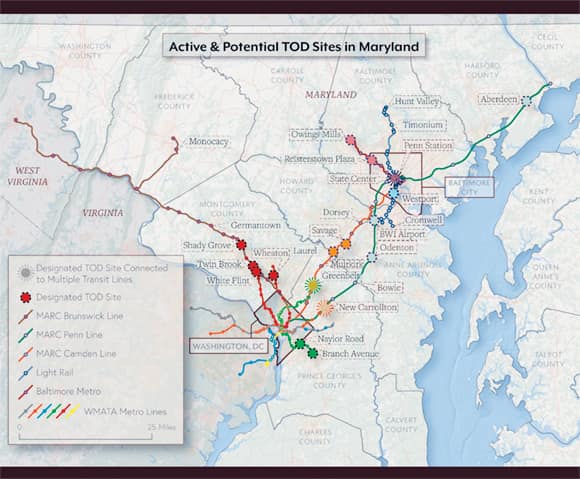
Recently, MDOT’s statewide headquarters—which coordinates five business units including highway, transit, port, aviation, and motor vehicles, along with an authority for tolls and bridges—was looking for a way to incorporate visually engaging, detailed maps into transportation plans, presentations, press releases, and capital programming. The planning team needed its maps to be clean and appealing to help public officials, government agencies, businesses, and citizens better understand proposed or implemented plans.
“As a planner, I create many static maps,” said Andrew Bernish, a transportation planner and GIS analyst with the KFH Group, which contracts with MDOT for transit planning. “These maps carry more gravitas if they are well designed.”

But while urban transportation planners are often well versed in GIS, they tend to be less experienced in design. That is why Esri developed ArcGIS Maps for Adobe Creative Cloud, which empowers GIS users and creative professionals to work with and design data-driven maps inside Adobe Illustrator CC and Photoshop CC.
Using Familiar Tools
Bernish and his fellow MDOT planners were already using ArcGIS Desktop to manage and gather data, as well as ArcGIS Online for its selection of basemaps and other content, including the public data it gets through the state’s MD iMAP Portal. So Bernish, who was moderately familiar with some Adobe apps, decided to try ArcGIS Maps for Adobe Creative Cloud to really make his maps pop.
“My maps have been referenced more often when I have emphasized design in their execution,” he reflected.
Previously when Bernish wanted to make a specifically designed map, he had to open shapefiles in ArcGIS Desktop and export the corresponding geography to Illustrator. He then had to release the clipping masks, ungroup the layers, and go through several more stages to even begin to work with the data.
But with ArcGIS Maps for Adobe Creative Cloud, users no longer have to load geospatial data into the ArcGIS platform only to export it to Adobe. Now, they can add ArcGIS content and local data to a map within Illustrator or Photoshop and then edit the map so it conforms to an organization’s own design and branding.
Getting the hang of these processes did require a bit of acclimation, but Bernish watched a series of instructional videos from Esri to learn all he could about the new solution. Then he jumped right in by adding his own data and shapefiles directly into Illustrator.
“Like most things, it takes some practice to get used to the new toolsets,” he said, “but it can make your workflow more efficient.”

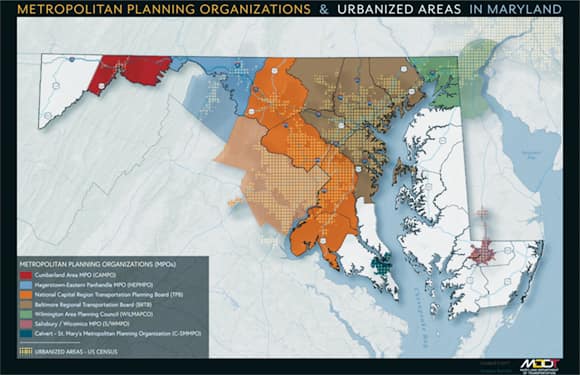
One of the maps Bernish created using ArcGIS Maps for Adobe Creative Cloud shows all the metropolitan planning organizations (MPOs) and urbanized areas in and around Maryland. MPOs help implement transportation planning in localities that have more than 50,000 people living in them, so a map like this is valuable when evaluating grants, programs, and funding.
“This map utilizes several different pattern fills (dots and parallel lines), transparency, and shadowing,” Bernish explained. “For instance, the map needed to identify, but differentiate, the geographic areas of MPOs where they fall outside Maryland’s state boundary. By using the same color for the MPO throughout, the map can subtly differentiate the portions present in and out of Maryland by displaying a different fill pattern, or swatch. In addition to the MPO boundaries, state borders, county borders, and major roadways, the map needed to depict urbanized areas in order to show what areas the MPOs serve. This required yet another distinct swatch layered in the same geographic area.”
Although it is technically possible to make styles like these using only ArcGIS Pro or ArcMap, it is more efficient to create the layering and intricacies of these visual elements using Adobe Creative Cloud, according to Bernish.
The finished map depicts information for local, state, and federal agencies in rich detail. It is now used across several agencies in the state and has also been promoted as a featured printed map on the MD iMAP Portal.

As a planner, I create many static maps. These maps carry more gravitas if they are well designed.
Greater Creative Control
By using ArcGIS technology and Adobe Creative Cloud together, Bernish helped MDOT achieve its goal of producing maps with a design aesthetic intended to better engage with the public.
“There is often a difference between [the] design quality provided by public agencies and private firms, but there does not need to be,” Bernish said. “Public agencies are taking design into account more often. The public should have direct access to maps with higher design considerations.”
The integration of ArcGIS software with Adobe Creative Cloud apps offers MDOT the benefit of having greater creative control while using familiar tools. Employing ArcGIS Maps for Adobe Creative Cloud allowed Bernish to eliminate the sometimes tedious work of transferring detailed GIS data to Adobe. Now, he directly imports shapefiles and pulls content straight from ArcGIS Online into Illustrator CC and Photoshop CC.
“Our agency is quite pleased with the design aesthetics in the maps, and we have received positive feedback,” he said. The process of transferring substantial amounts of data into geospatial visual depictions has also become more efficient and enjoyable.”

