ArcGIS Online Was Just the Ticket
The Tampa Bay Partnership, the regional economic development organization for the eight counties of west central Florida, was founded in 1994 by business, civic, and government leaders to promote Tampa Bay as a business destination. In the course of nearly two decades, the efforts of the not-for-profit partnership have paid off handsomely, as Tampa Bay is well known nationally as a premier business location.
For the bulk of its history, the partnership focused on messages related to low costs of business, specifically, taxes and wages that leveraged quality-of-life imagery. By 2008, the Internet and global business locations across the globe had undercut much of Tampa Bay’s traditional advantages, and partnership leaders astutely recognized the need for a research-based, next-generation blueprint for economic development.

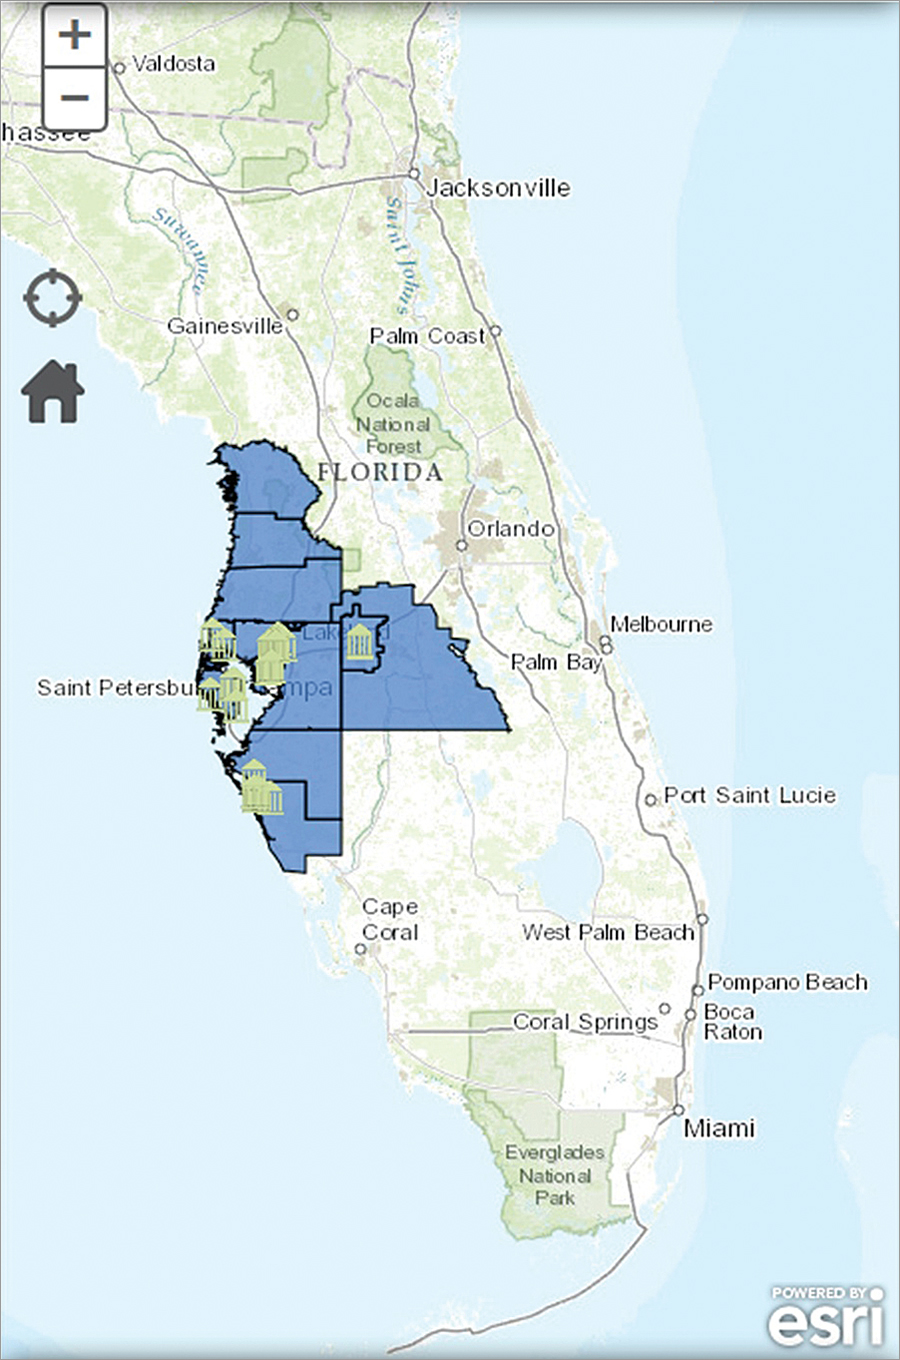
From this recognition, a 16-initiative, 72-activity Regional Business Plan for Economic Development in the Tampa Bay Region was released in 2011, and among these, “Initiative 1, Activity 1” called for the development of a GIS-enabled asset map depicting Tampa Bay’s industry, work force, and research assets along key target sectors (Applied Medicine & Human Performance; Business, Financial & Data Services; High-Tech Electronics & Instruments; Marine & Environmental Activities) to promote a renewed identity of the Tampa Bay region as an integrated, innovative economy.
The Enormous Challenge
As the Tampa Bay Partnership’s professional staff contemplated the enormity of the task—as well as that of the opportunity—that this asset map represented, several constraints were quickly identified. Primary among them was limited human capital that could be deployed in developing and keeping the asset map content across a 6,500-square-mile, 4.3-million-population footprint relevant and up-to-date. Furthermore, while the target sectors had been primarily generated using data available at the aggregate (i.e., county-level industry statistics) and illustrated by some already well-known firms, there was no comprehensive list of “assets”—specific companies—at hand.

In short, the two-person business intelligence team at the partnership faced two distinct but interlinked tasks: asset inventory and map application development. On the inventory side, the partnership had its eponymous partners that could provide trusted, street-level intelligence on assets resident in their communities, but for data quality purposes, the organization was wary of opening the inventory to nonknown entities without performing due diligence. An additional concern regarding the shared refinement of asset inventories was how to stay out of the “weeds” of data entry, as most assets suggested by external parties would arrive one by one as opposed to in bulk. Finally, almost no task this side of the Manhattan Project operates absent financial constraints. In summary, an asset map solution for the Tampa Bay Partnership needed to be publicly accessible (it’s a marketing activity after all), accommodating relevant feedback and relatively inexpensive beyond anticipated initial development costs.
The Ideal Solution
The partnership research team possessed basic knowledge of GIS concepts and passing familiarity with the Esri suite of products, and the team’s investigations led to the then recently released ArcGIS Online. With the hunch that ArcGIS Online would be the optimal solution, the partnership reached out to Esri Partners based in Florida through esri.com/partners. After reviewing several competitive proposals, the Tampa Bay Partnership selected Esri Silver-Tier Partner URS Corporation of Tampa, Florida, to develop the partnership’s next-generation economic development tool. Overall project management and select technical activities were handled from the Tampa office, with the bulk of application development supported by the Germantown, Maryland, office of URS.
The ArcGIS Online solution crafted by URS led to three distinct workflows developed using custom ArcGIS Online templates. The Asset Submission Portal permits external parties to suggest or recommend a relevant asset (e.g., a business, an educational program) for inclusion in the asset map. The submission portal encourages volunteered geographic information and utilizes drop-down menus to both ease and guide data entry for required fields. A critical required field is the e-mail address of the individual submitting an asset for review. Upon completion of the required fields and submittal, the external party receives an e-mail message requesting confirmation of the submission. Once confirmed, the business intelligence team is able to see the suggestion in the Asset Verification Portal.

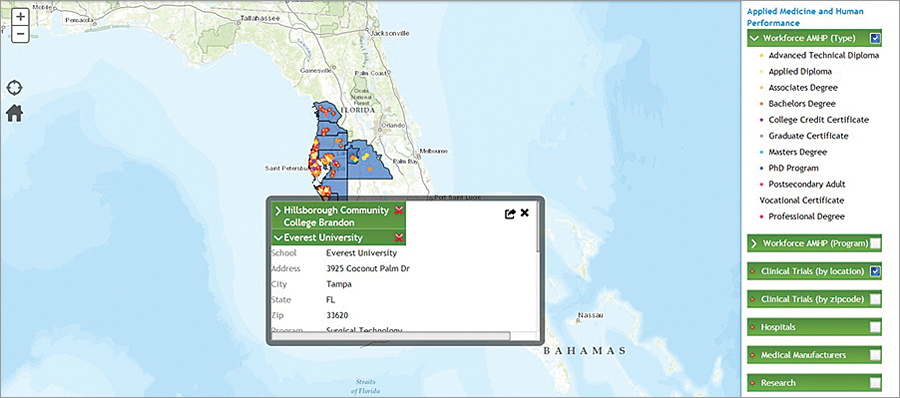
The initial screen of the verification portal shows the asset name and the e-mail address of the external party, permitting administrators to quickly verify assets submitted by trusted, known, external parties. Once verified, assets are published to the Asset Viewer, the public face of the asset maps. For the viewer application, the business intelligence staff worked closely with the URS team to develop an enhanced user-defined experience, including point-within-polygon selection, and download options in a “briefcase” utility. These enhancements democratize the audience’s ability to probe and understand the regional economy. Also, to ensure maximum accessibility, the Asset Viewer was developed with responsive design techniques so that it’s usable on mobile devices with no loss in functionality.
The Tampa Bay Partnership launched its Applied Medicine & Human Performance Asset Map, in conjunction with BioFlorida’s (a statewide industry association) annual conference in September 2013 to wide acclaim, and the map serves as a centerpiece of the partnership’s marketing efforts for 2014. Thanks to the flexibility of both ArcGIS Online and the applications developed by URS, the partnership envisions deploying asset maps that go beyond the marketing message and are instead more focused on transactional economic development activities, such as reducing procurement leakage from the region, by helping manufacturers find and be identified as qualified vendors.
About the Author
Dave Sobush is a certified economic developer and business intelligence manager for the Hillsborough County, Florida, Economic Development Department. Formerly, he served as vice president of Regional Business Planning & Development for the Tampa Bay Partnership.
For more information, contact Katie Franco, senior vice president, Regional Initiatives, Tampa Bay Partnership, or contact Carrie Aurit, GIS manager, URS Corporation.

