As part of the February 2015 update to ArcGIS Online, Esri introduced an exciting new capability: Smart Mapping. This new approach to making maps is driven by Esri’s desire help people make visually stunning and useful maps, quickly and confidently.
To do this, Esri has added new ways to symbolize data, smart defaults, and data-driven workflows to the ArcGIS Online map viewer. Continuous color ramps and proportional symbols, improved categorical mapping, heat maps, and new kinds of bivariate maps using transparency are delivered via a streamlined and updated user interface.
Smart Mapping is more than an easier way to make new kinds of maps. Esri articulated and then programmed deep cartographic first principles into ArcGIS Online that became a set of interconnected smart defaults that create data-driven workflows. Unlike dumb software defaults that are the same every time, smart defaults offer the right choices for the context.

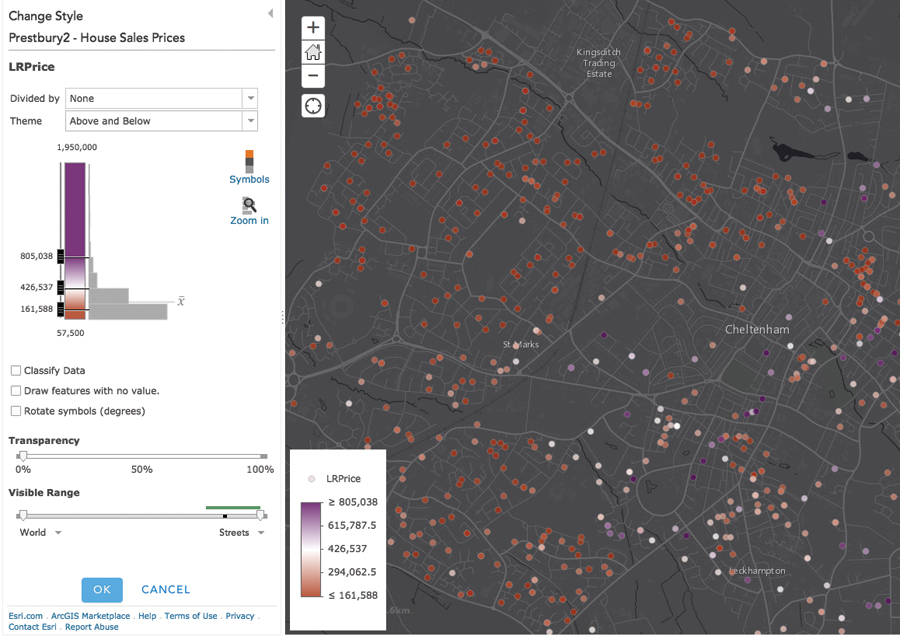
The software analyzes data in the map viewer quickly in a variety of ways to display choices that are driven by the type of data in the map, the kind of map you want to create, and the kind of story you want to tell. For example, if you are making a map to show places that are above and below the national average for some characteristic, Smart Mapping makes this easy.
Esri’s goal is to take the guesswork out of the hundreds of available settings and choices so your maps are cartographically appropriate and look wonderful. Even if you don’t have a degree in cartography or GIS, you will be successful. This also means you can work much faster because you spend less time iterating versions of your maps.

Smart Mapping does not take control away from map authors or dumb down the map authoring experience. It just offers smarter initial parameters for the map (e.g., color, scale, styling). Mapping pros still have full control over map creation. Esri simply improved the process and removed defaults that provide the wrong choices for your data and story. Whenever possible, Esri has embraced a live styling philosophy so you can see the changes you’re making almost immediately on-screen. Design is visual, so authoring tools should provide visual feedback. That’s why Smart Mapping benefits novices and experts, making both more productive.
For example, Bounded Proportional Ramps is innovation added to handle the problem of extreme values and outliers overly influencing unclassed color ramps and proportional symbol maps. Rather than mindessly stretching a color ramp (or expanding the size of the symbols) to include the smallest and largest data values, the map author can now visually explore how colors and sizing are applied to the data, using the handles that are available in the histogram and ramp view. Values can be grouped together or certain parts of the data range emphasized. The initial position of the sliders is automatically determined by smart data-driven defaults that are based on a statistical analysis of the data.
Smart Mapping capabilities can support and improve your mapmaking. To learn about all the details of the ArcGIS Online February update, visit ArcGIS Online Help What’s New.
Some Questions with Answers
Can ArcGIS Online make cartographic choices, such as picking the right colors, line weights, and opacity, so they harmonize with the basemap I am using (e.g., World Topographic Map or National Geographic World Map)?
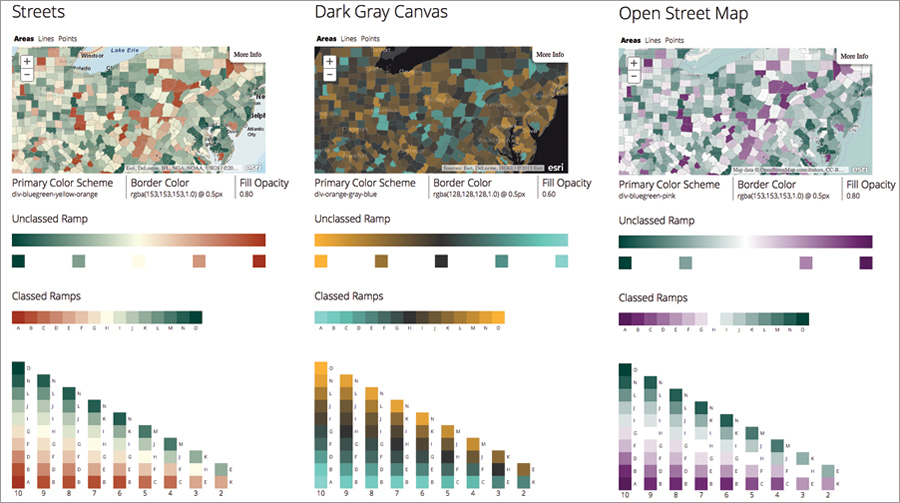
By automatically coordinating styling to harmonize with basemap tiles, Esri gives you pro-level design right out of the box. No single default color scheme or color ramp looks good or performs well on all basemap tile sets. Esri has taken the guesswork out of this process by creating professional and reliable colors and styling specs (line weights, border colors, opacity amounts) custom designed to pair with data displayed on Esri basemaps. This builds on the earlier success of the Color Brewer schemes by introducing a new series of professional multihued, perceptually graded color schemes for categorical, sequential, and diverging color ramps, along with improved unique value and single symbol color specs.
Although this is its first appearance, Smart Mapping is a new mapping philosophy and approach to cartography that will infuse all of Esri’s mapping tools.
Can ArcGIS Online automatically determine and set the appropriate zoom levels for this map based on my data?
Yes. Interactive maps must have a maximum and minimum zoom level (also known as the visible range). Setting these scale limits properly is essential but somewhat tricky, but ArcGIS Online handles this for you.
How can I identify appropriate ways for mapping my data?
The new gallery browser in the map viewer will let you quickly determine which choices will be appropriate so you can decide which will give you the best way to represent your data.

