The City of North Augusta, South Carolina, is considered part of the greater Augusta, Georgia, metropolitan area. Approximately 22,000 residents enjoy the advantages of being near a major metro area while gaining the benefits of living in a small town, including very dedicated staff within local government departments.
The city employs 244 full-time employees in the 21-square-mile boundary known as South Carolina’s Riverfront, a reference to its location along the Savannah River. While the City of North Augusta has used ArcGIS technology for more than 10 years, in the beginning, GIS was mostly for the planning department.

When GIS analyst Kevin Whaley joined the city 10 years ago, however, he knew that GIS use needed to expand. As the team lead for the city’s GIS Services Department, Whaley has championed the use of GIS across city departments. Today, the technology supports the mapping and geospatial needs of municipal water, wastewater, and storm water utilities; sanitation services; parks and recreation; and public safety. Whaley and his colleagues work diligently to provide useful tools—specifically, information-rich digital maps with layers of accurate asset data—to their internal stakeholders to help them easily locate city assets.
“GIS has grown from mapmaking to decision-making,” said Whaley. “Departments use various apps to aid in their daily workflows and projects.”
To stay current with ArcGIS technology and hone his skills, Whaley is active in the local South Carolina ArcGIS Users Group. When he attended the group’s annual conference in 2016, he went to a session on new Esri solutions and learned about a new app for coordinating field work assignments: Workforce for ArcGIS.
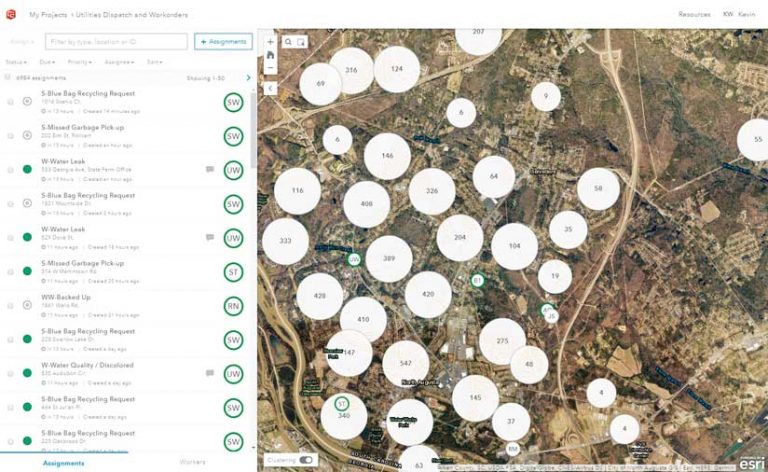
Workforce is a mobile app used to manage field projects and dispatch assignments to employees. Fieldworkers use it to receive assignments and report on their status. In the web app, a dispatcher can see each worker’s location and status, making it easier to manage calls that require immediate attention.
Whaley contemplated whether Workforce could replace North Augusta’s City-wide Action Tracking System (CATS). This system had a record of each property and made it possible to coordinate calls from constituents for various services with paper work orders. Constituents could ask for assistance by calling the city or submitting a service request on the city’s website. As requests came in, they were handed off to a dispatcher who entered them into CATS. Then, a hard copy of the request was printed and used as a work order. It was a cumbersome and inefficient process.

Working with the city’s Esri account manager, Whaley scheduled a demonstration of Workforce in April 2017 for the utility department’s director, supervisors, and dispatcher. The presentation featured a simple project scenario and used the city’s digital map with its utility layers, so staff could see how Workforce consumed and applied the data. The utility director and staff requested that Workforce for ArcGIS be implemented as quickly as possible.
Whaley recognized that implementing and deploying Workforce would depend on acquiring a clear and thorough understanding of each step of the fieldwork process. He met with stakeholders from the utility department to define the requirements for each person and part of the process. Next, Whaley and the dispatcher met to determine how the required tasks for recording constituent service calls and assigning them to field staff could translate in the new digital system.
Finally, armed with a schema that he and the dispatcher had defined, Whaley created the city’s first Workforce for ArcGIS project. When a call came in that demanded immediate attention, the dispatcher was able to identify the resource nearest the call and quickly arrange a response—all from looking at the location of the fieldworkers on a Workforce map from her workspace monitor.
The paper work orders that the city used previously were no longer needed because the assignments were all managed digitally. Fieldworkers now receive their assignments through the Workforce mobile app on their city-issued smartphones and report back throughout the day with status updates as they go from task to task. Fieldworkers no longer have to start the day in the office picking up work orders, nor do they have to return throughout the day to get new ones or go back at the end of the day to drop off completed assignments.
Despite fieldworkers’ initial skepticism, they quickly adopted the technology. They liked being able to sort their assignments by proximity and appreciated not having to carry paper work orders. Best of all, they increased productivity, bringing the time it takes to complete an assignment down from an average of 1.5 days to 8 hours. They also started driving less, which saved on fuel.
The dispatcher reported feeling a greater sense of control over assigning and monitoring tasks and was happy to not have to transcribe notes and data from paper reports. For the first time, she was able to accurately identify the status of any service call in the system and could even report progress based on worker, area, or type of call. When a constituent called in with an urgent need, the dispatcher could now enter the assignment in the system, fill it out, and assign it to a fieldworker before hanging up the phone.
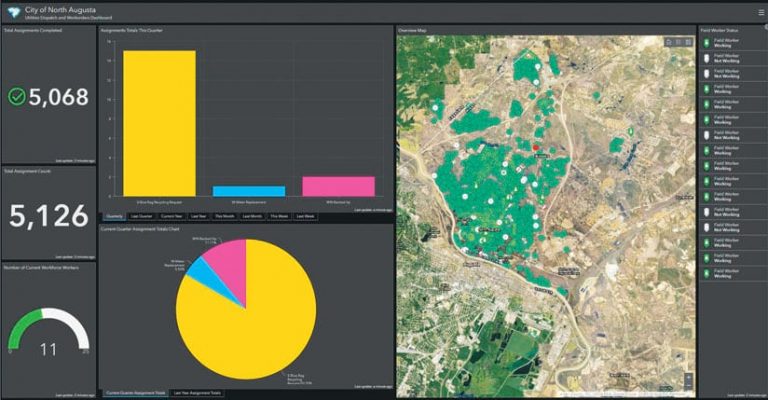
City leaders were excited about the increased productivity and data accuracy that Workforce afforded. To help directors and supervisors see the progress of field activities, Whaley created an executive dashboard using Operations Dashboard for ArcGIS. It displayed the Workforce data with the help of visualizations, such as gauges and bar charts, that compared data by week, month, quarter, and year.

“The implementation of a dashboard within Workforce has brought us a dynamic, real-time view of calls for service in the City of North Augusta. By delivering a live, visual, location-based representation of these calls for service, our crews are much better positioned to prioritize and streamline their workload,” said IT director Chuck Ursy. “Workforce also assists our ability to project future staffing needs by having detailed call data at our fingertips.”
For fieldworkers, being able to use Workforce on their phones and tablets not only streamlined the work order process but also gave them a reliable map of the utility network that was more accurate than the paper maps they used before. When changes are made to the map, workers see the updates in real time, so they are always working with the most current city maps and data. Now, fieldworkers are champions of the new digital system.
The city administrator, utility director, and staff members value the insights the dashboards provide as well. It gives them greater control over planning and day-to-day operations, including staffing needs, dealing with aging infrastructure, and analyzing assignment data to inform decisions.
While Whaley is pleased with the success of the city’s Workforce for ArcGIS implementation, he sees many opportunities for using ArcGIS field operations apps to further improve workflows in other departments. He routinely receives new requests to use GIS data to inform decision-making. Recently, the environmental coordinator was able to use wastewater reports to analyze whether backups had occurred in the city’s watershed or basins—information that is required for compliance reports. The ability to do this did not previously exist.
Since implementing Workforce for ArcGIS, there has been a huge increase in the volume of data the city has collected. Whaley knows that he and his team are just scratching the surface of how GIS will be used to enhance quality of life in North Augusta.

