Students at Villanova University Used the Technology to Discover Trends and Patterns in Their Data
When his outdoor environmental geology class moved online in March 2020 due to the coronavirus disease 2019 (COVID-19) pandemic, Steven Goldsmith, associate professor at Villanova University’s Department of Geography and the Environment, needed to update his curriculum. Online courses are not a new concept, of course, but rapidly transitioning to virtual classes can be challenging for even the most dynamic instructors.

Unique circumstances require creative solutions, so Goldsmith embraced ArcGIS Insights, analysis software that fuses location analytics with open data science and business intelligence workflows. This technology enabled him to seamlessly continue his semester online despite the abrupt shift to his traditional pedagogy.
An Outdoor Lab Moves Indoors
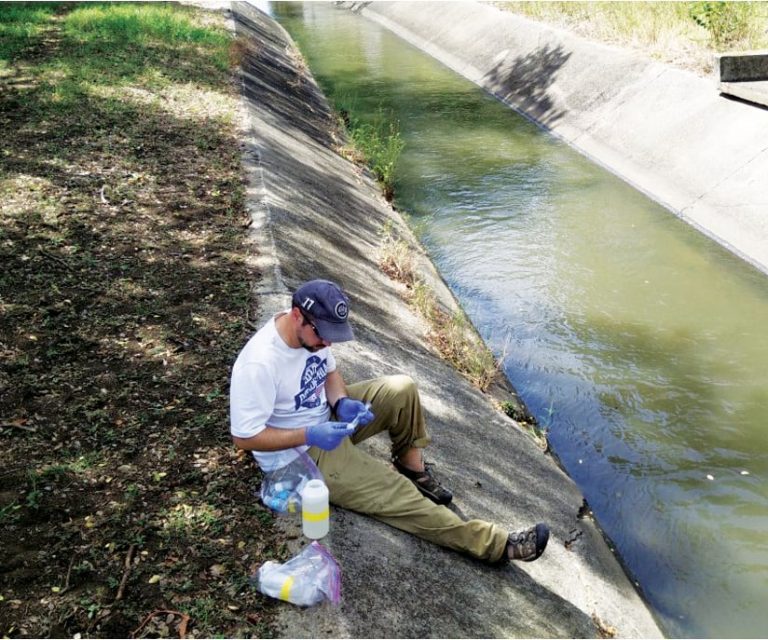
Like many teachers and professors in the spring of 2020, Goldsmith realized that his curriculum required significant modifications to make it work for remote learning. He only had four days to develop a plan to migrate his material online. His outdoor lab needed to come indoors and had to be made virtual.
Having already heard of ArcGIS Online, Goldsmith saw its use as a potential path forward. But there was one problem: he was not a GIS expert. He had attended his last official GIS course in 2008, and an immersive ArcGIS refresher seemed out of reach, since it would take too much time for him to relearn so much while the clock was ticking. He had to rewrite and finalize his class exercises right away.
With almost no time to spare, Goldsmith had to make decisions on how to update his curriculum.
A Simple Way to Do Spatial Analysis
Goldsmith reached out to Esri solution engineer Eric Wagner—who had worked with some of his research students in the past—to see what options were available to him for teaching. Goldsmith ended up being able to take advantage of some of the significant advances in capabilities and functionality that have been made to the ArcGIS platform since he had last used GIS, many years ago. Guided and trained by Wagner, Goldsmith quickly learned about many of the geospatial apps immediately available to him and his students—specifically Insights.

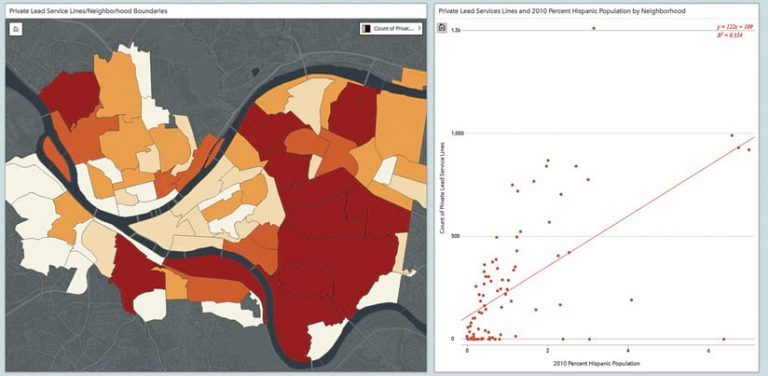
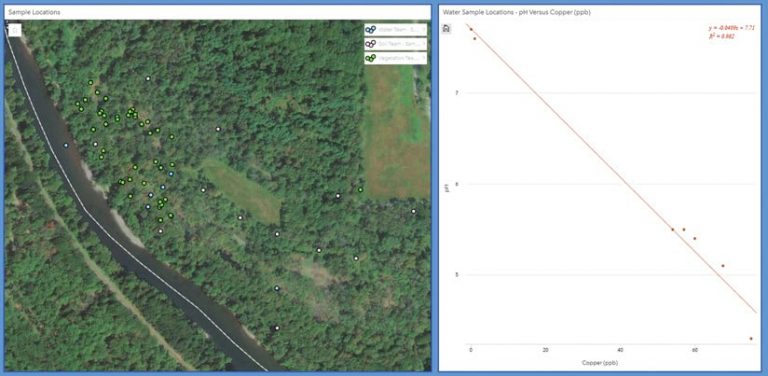
With spatial analysis and visualization at its core, Insights enabled Goldsmith and his students to create more than a dozen different types of interactive graphs, maps, charts, and tables on the fly. This would help them better understand their data through spatial and nonspatial relationships. Using a simple drag-and-drop interface, the students could continue their environmental analyses—which involved working with soil, water, air, and vegetation chemistry data—online.
“It was definitely way easier to create graphs and charts,” said Jayne Hickey, a senior who is earning a double major in environmental science and communications. “We could play around and try different approaches to see which was the best representation of our information much [more easily] than if we were just using [Microsoft] Excel.”
Being miles away from campus did not stop Goldsmith’s class from learning, and using Insights allowed students to better understand their data through a geographic lens.
“I was not only impressed with the data visualization capabilities of ArcGIS Insights but also its ease of use,” said Goldsmith. “I was able to understand its functionality and capabilities after interacting with an Esri solution engineer for less than an hour, which, in turn, allowed for an easy introduction of the app to my students.”
An App That’s Here to Stay
Change is never easy, especially when the allotted time to adapt is limited. But Insights brought new geospatial acumen into Goldsmith’s redeveloped course almost overnight.

Initially, he was only going to use Insights in one laboratory exercise, but because of its ease of use and powerful analytics, he included it in other class activities as well. After discovering that the app could enrich existing spatial data with a wealth of demographic and socioeconomic data, Goldsmith and his students used it to uncover environmental justice trends along with their earlier environmental science findings. The students even used analytics from Insights for their final projects as a means to share the patterns they discovered in their analyses.
“Overall, I liked using ArcGIS Insights and would use it again,” said Hickey.
Though the 2020 spring semester was Goldsmith’s first experience using Insights, it certainly will not be his last. The app made analysis and visualization easy, even for those who are new to or long removed from working with ArcGIS technology.
Goldsmith looks forward to keeping Insights in his environmental geology class, where he introduced it, as well as bringing it into the introductory-level environmental science and advanced watershed biogeochemistry courses he teaches.
“ArcGIS Insights allowed my students to visualize their data at the click of a button,” said Goldsmith. “The platform enhanced their ability to independently explore data relationships and take ownership of the process.”
What started as a challenge to overhaul his class with only a few days’ notice turned into an opportunity to leverage modern GIS technology in a non-GIS class. Goldsmith’s Insights app-based laboratory exercises are here to stay.
Academic institutions with an Esri Institutional License or Academic Departmental License have access to ArcGIS Insights through ArcGIS Online. Users should contact their ArcGIS Online organizational account administrators to update their permissions.

