As one of the fastest-growing metropolitan regions in the United States, Baton Rouge, Louisiana, has been described as a mid-size city with big-city problems. The Louisiana capital faces significant challenges including traffic, violent crime, and severe weather events.
The information services (IS) department at the City of Baton Rouge-Parish of East Baton Rouge delivers IT services and technology to create a more effective and responsive government for the city’s expanding population. Recently, IS helped city officials take on a significant challenge: improving how service requests from citizens are handled.
Baton Rouge’s public officials needed better tools for visualizing and filtering the thousands of citizen service requests they receive on a monthly basis. So the IS department’s GIS team was called on to create a dynamic dashboard to simplify data analysis and viewing.

“Our vision for our GIS program is to extend GIS and its capabilities to benefit not only our local government but also our entire community,” said Warren Kron, the GIS manager for the City-Parish IS department.
Envisioning a Better Way to View and Share Data
The GIS team within IS consists of nine GIS staff members who support all City-Parish agencies with a variety of requests, from administering surveys and performing data analysis to making custom maps. With an increasing number of citizen service requests coming in, city officials asked the GIS team for a better way to manage and view the large amount of associated data.
The GIS team worked with programmers to spatially enable the 311 call data, which includes resident-reported issues such as potholes, grass that’s too tall, and missed solid waste pickups. But the real challenge involved developing a comprehensive solution that would simplify how city officials displayed the data in a desktop app to communicate this information in public meetings.
Moreover, the GIS team wanted to come up with a better way to relay any associated open data to the public. The City of Baton Rouge has executed a strong open data initiative to increase transparency, and IS has published hundreds of datasets for the public. The GIS team wanted to enhance the open data user experience by providing location-based information along with easy-to-use filtering tools to help residents answer their own questions when possible.

Dressing Up a Database and Making It Interactive
After examining other data management solutions, the GIS team decided to create a dashboard using Operations Dashboard for ArcGIS. The IS department initially began using the tool for emergency operations and response but pretty quickly recognized its potential to support other business workflows, such as 311 data visualization and analysis. It would allow the GIS team to aggregate numerous datasets and display the information in a single, dynamic dashboard.
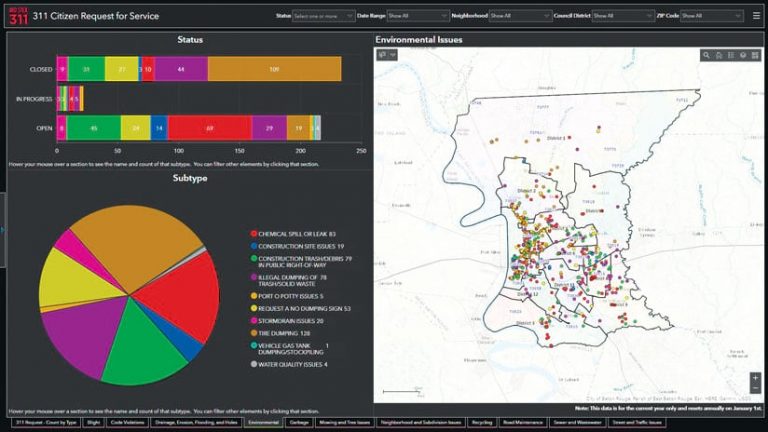
The 311 dataset provided by IS comprises all service requests received from the City-Parish 311 call center, including ones made over the phone, online, and through the 311 mobile app. Reports to 311 are recorded in a database and then transferred to the IS department’s enterprise GIS database for analysis. The GIS team took this tabular data, spatially enabled it, and created a 311 dashboard that now presents the information in an easy-to-read format that combines interactive maps, pie charts, and bar graphs.
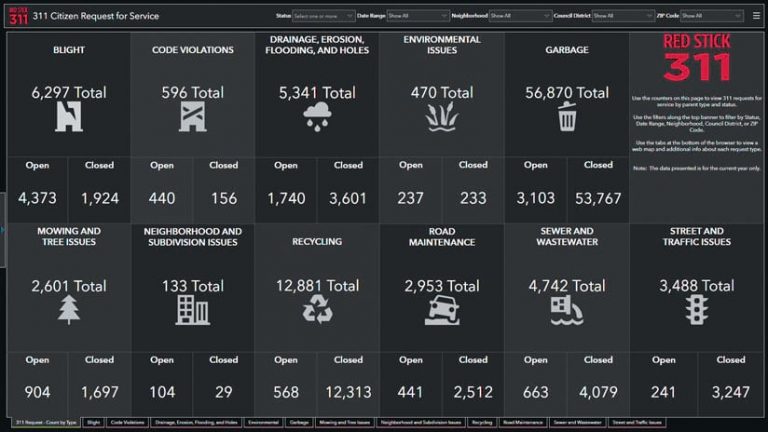
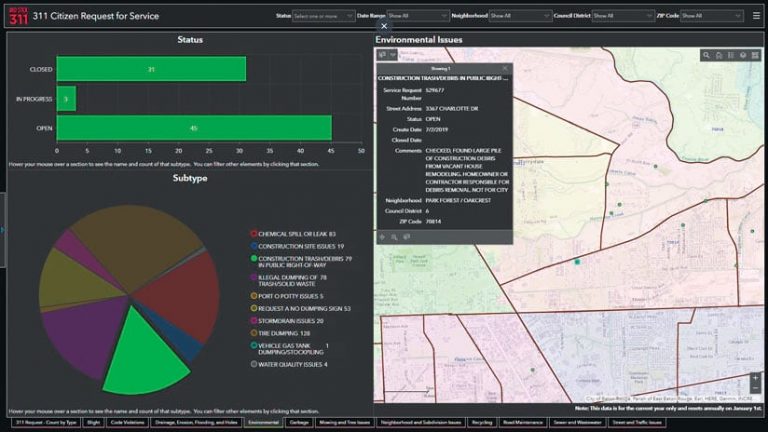
When users open the 311 dashboard, the initial view displays a count of all open, in-progress, and closed tickets by parent category, such as blight, drainage, and transportation. Users can then apply filters to view data by neighborhood, type of 311 request, request status, date range, council district, or ZIP code. When users select a pie slice related to a particular subtype, the parent category’s map updates. Selecting an individual service request provides users with detailed information related to the reported issue.
“Our dashboards are powerful, but they’re driven by the hard work of [the] information services [department], who intake and manage data,” said Brandon Jumonville, senior GIS analyst with IS. “The meaningful data in Operations Dashboard for ArcGIS will help inform decisions and inform the public.”
Seeing the Whole City, Then Relevant Areas
From increased transparency to improved communication, the GIS team and IS as a whole have seen significant benefits from using Operations Dashboard. Jumonville said that the ability to graphically and visually provide information to stakeholders and the public has made a more “meaningful impact,” as it is much easier for people to understand the 311 information and what’s occurring in their city. Previously, data was only available in tabular format.
Most citizens or policy makers may not be familiar with GIS data. The 311 dashboard provides a broad overview but then allows users to easily filter the data to see what is meaningful and relevant to them. It’s an easy system for users whose GIS knowledge varies widely.
“Operations Dashboard for ArcGIS gives us the power to extract data, process it, and communicate it in a way that’s easy to understand,” he said. “We now have the opportunity to get the information out across a wide variety of disciplines and organizations.”
“Operations Dashboard for ArcGIS lets us take our open data and present it in a new, more useful way for city officials, law enforcement, and the public,” added Kron.
The filtering capability in the 311 dashboard has improved the user experience, allowing users to view only the information they want. And with the maps, users can simply find and select service requests around a particular area to view associated information, without having to search thousands of records in a table.
“I think that’s the power the dashboard provides. Most citizens or policy makers may not be familiar with GIS data,” said Jumonville. “The 311 dashboard provides a broad overview but then allows users to easily filter the data to see what is meaningful and relevant to them. It’s an easy system for users whose GIS knowledge varies widely.”
Another benefit of the 311 dashboard is that there are enough basic analytical tools for users to employ to answer spatial questions on their own without having to request the GIS team to analyze the data.
“Operations Dashboard has rapidly evolved from when we initially started using it. We have basically automated the work of an analyst using this tool,” said Kron. “It’s made it easier for our GIS analysts to configure our data in a user-friendly format.”

Uses for Operations Dashboard Get Expanded
Citizens have responded positively to the platform as well. According to Kron, when IS presented the dashboard to neighborhood groups, city residents were amazed that so much information was available to them for free. He said it’s been a “win-win for us and the public,” which has helped the local government increase transparency and build public trust.
Neighborhood associations are now using the 311 dashboard to provide details on what’s happening in their neighborhoods, and local universities are employing the open data for research. Other organizations are creating additional dashboards with the data, too, including several for the Public Safety Common Operational Platform, also known as PSCOP. This secure ArcGIS Online platform gives law enforcement personnel access to near real-time data and helps them identify crime trends and patterns, as well as keep better track of officers in the field.
Overall, the promising uses of Operations Dashboard for Baton Rouge are expanding rapidly.
“Operations Dashboard for ArcGIS has given our city access to information, increased data sharing and transparency in our operations, and provided different toolsets for people that never had [them] before,” said Kron. “We are excited for all of the possibilities, moving forward.”

