New Layers in ArcGIS Living Atlas of the World Show Where Consumers’ Fish Comes From
Fish is a significant source of protein for more than 3 billion people around the world, according to the World Wildlife Fund. And fish consumption has increased by roughly 3 percent annually over the last 60 years—almost double the population growth of 1.6 percent—according to the Food and Agriculture Organization of the United Nations. This demands a global industrial fishing effort that spans the farthest reaches of the oceans and, in many places, applies unrelenting pressure to fish stocks, sovereign waters, and sensitive ecosystems.
It is estimated that only 25 percent of global fishing activity is actively tracked or monitored, according to a recent article published in Nature. This allows fleets of so-called dark vessels, many of them small, to contribute to humans’ growing appetite for fish. Except that lots of these vessels skirt regulations, disregard sovereign state territorial boundaries, and apply increasing pressure on the ocean’s resources and fragile ecosystems.

To take action to protect vital marine resources for future generations, people need a better understanding of where fishing activities are taking place throughout the world. But the global fishing footprint hasn’t ever been quantified—until now.
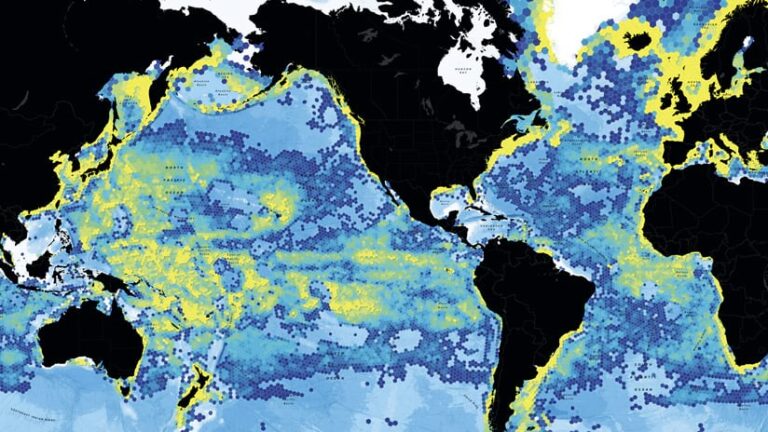
With new fishing layers in ArcGIS Living Atlas of the World, users can gauge fishing intensity around the globe by locating fishing vessels and illuminating their activity on a map.
New Layers Show Intensity of Fishing Activity
Esri recently added new global fishing intensity layers to ArcGIS Living Atlas. These one-kilometer-resolution, multidimensional datasets are the product of Global Fishing Watch, an independent international nonprofit that provides a global, real-time view of fishing. Global Fishing Watch makes human activity at sea publicly accessible.
One of the layers—Global Fishing Intensity (Year 2020)—provides a global summary of fishing vessel activity throughout the world’s oceans. The data comes from the Automatic Identification System (AIS), a network of terrestrial receivers that monitors the movement and location of equipped vessels. It is represented as the total hours that all known fishing vessels are operating within each one-kilometer cell for the year 2020. This snapshot consists of two multidimensional variables: vessel hours and fishing hours. Vessel hours displays any fishing vessel activity within that cell, including transit to and from port, while fishing hours shows only apparent fishing activity as detected by Global Fishing Watch.

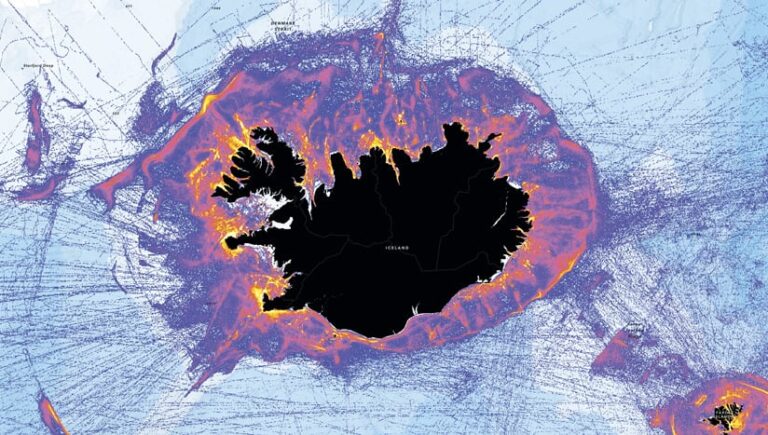
The other layer, called Global Fishing Intensity – Monthly Time Series (Year 2020), provides a more granular look at fishing intensity with monthly summaries for 2020. As with the yearly service, both vessel hours and fishing hours are available for visualization and analysis in ArcGIS Pro and ArcGIS Online. This layer can show the change in monthly fishing intensity in the waters around, say, Iceland—the country with the highest per capita fish consumption in the world, according to the World Economic Forum.
Deep Learning Ascertains Important Unknowns
Since fishing vessels don’t actively broadcast when they switch between transit or fishing activity—and dark vessels circumvent tracking—Global Fishing Watch employs innovative techniques to classify vessel activity. In addition to using satellite-based positioning technology and the AIS, the nonprofit employs machine learning to make educated guesses about whether a vessel is fishing based on the speed, direction, and shape of its track in the water.
If a vessel is taking a direct route to or from a port, it is probably in transit. If it is creating figure-eight shapes, following bathymetric features or contours, or steering around regulatory or sovereign boundaries, it is probably fishing. Using 22 billion AIS vessel positions collected from 2012 to 2016, while employing convolutional neural networks (CNNs)—a type of deep learning network—Global Fishing Watch modeled what fishing activity looks like. The model, which is part of both Global Fishing Intensity layers, is currently 90 percent accurate.
Combine Layers to Dive Deeper
What can users do with these layers? A lot, actually.
Exploring global patterns of fishing intensity shows that certain waters are heavily fished while others aren’t. But why? Combining the fishing intensity layers with other layers in ArcGIS Living Atlas—such as bathymetry, marine protected areas, and sovereign boundaries—users can begin to answer these questions. Taken together, these layers can highlight sharp changes in fishing activity over time, in certain spaces, and at various depths.

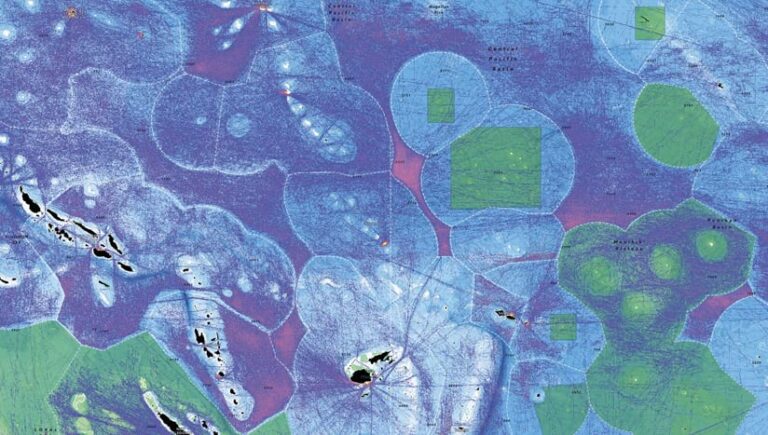
For example, users can employ equal area hexbin summaries in combination with the monthly fishing intensity service to determine regions where fishing activity takes place 1, 2, 3, or all 12 months of the year. Looking at sovereign offshore boundaries, known as Exclusive Economic Zones (EEZs), together with the data from the World Database on Protected Areas and the National Oceanic and Atmospheric Administration’s (NOAA) Marine Protected Areas, reveals why fishing activity is so heavily concentrated in seemingly random wedges of open ocean: because of fishing restrictions. These layers can also be helpful for monitoring possibly illegal fishing activity in the world’s most sensitive “no-take” zones—marine protected areas that don’t allow extractive activities, including fishing, mining, and drilling.
To go even deeper, users can combine Global Fishing Watch layers with AIS-provided vessel track lines from the U.S. Vessel Tracking app in ArcGIS Living Atlas to get details about individual fishing vessels and track their journeys to and from ports of call in the United States.
Transform Understanding into Action
The data that Global Fishing Watch has aggregated has the potential to transform how humans protect and manage the ocean by illuminating activity that was previously hidden. Used in combination with other authoritative layers in ArcGIS Living Atlas, this insight can help transform understanding into action, driving local initiatives and partnerships that reduce overfishing and habitat destruction.
For more detailed information on the new global fishing intensity layers in ArcGIS Living Atlas, explore the “Global Fishing Watch” ArcGIS StoryMaps story.

