During wildfires and other emergency incidents, emergency responders, public safety officers, and others work tirelessly to protect life and property. Perhaps lesser known is that a host of other professionals often partner with emergency responders to advise them on how to protect at-risk cultural and natural resources. Resource Advisors (READs) can be biologists, hydrologists, archaeologists, tribal liaisons, or specialists from other disciplines who, during an incident, focus on minimizing the impact of disaster response and recovery operations on ecosystems, archaeological sites, and protected species.
More than 80 READs worked on the Ferguson Fire that burned almost 97,000 acres in California in July and August 2018. As the fire spread across the Sierra and Stanislaus National Forests, Yosemite National Park, the homelands of five different Native American tribes, and swaths of private land, READs located sensitive resources and developed measures to protect them. Throughout all phases of the fire, they used Collector for ArcGIS to streamline their work and ensure that various teams had access to the most up-to-date and relevant information.
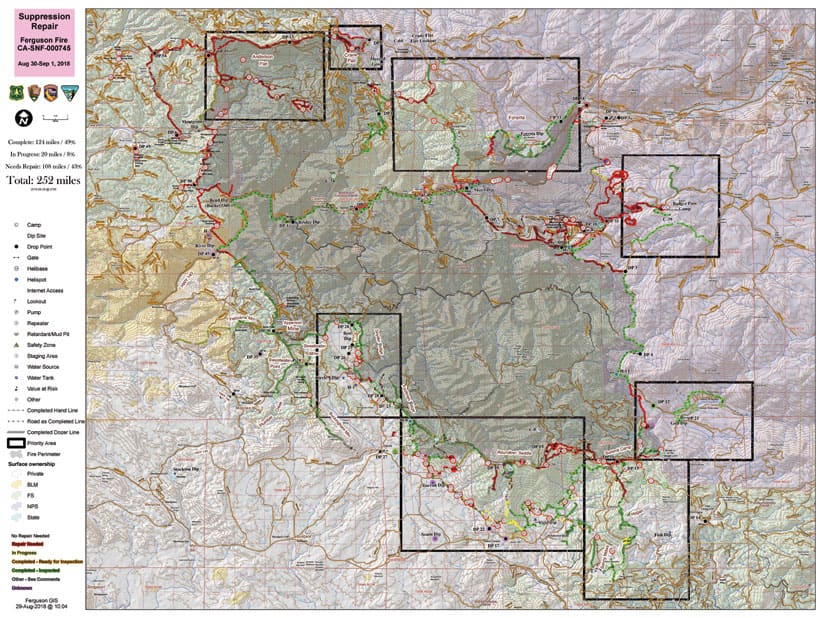
The two of us worked together as a GIS specialist and a READ during the suppression repair phase—when the Ferguson Fire was contained but many miles of dozer and hand line, plus hundreds of impacted sites, still needed to be repaired. While GIS has been used in fire operations for decades now, things were different for us in this fire. The recent adoption of Collector and ArcGIS Online transformed what was once a cumbersome process into a near real-time GIS operation.
From Hand-Marked Paper Maps to Digital Dexterity
On a fire, READs go into the field alongside fire crews to recommend and help implement measures to safeguard cultural and natural resources. In a typical day, READs can be seen protecting a sensitive archaeological site from being destroyed by equipment or saving historic buildings by wrapping them with fire-resistant foil. They recommend where to use lower-impact hand crews rather than heavy equipment. And after the fire has been contained, they help develop repair plans that specify how to restore slopes to limit erosion, where to disperse vegetation to benefit wildlife, and more.
To do all this, they rely on the same maps and GIS data that fire crews use, and then some. While READs are keeping track of fire operations, they also check up on sensitive sites and map areas that need to be repaired. Before they had Collector, they did this with a mix of paper maps, GeoPDFs, and handheld GPS devices. Each night, READs delivered their updates—often a combination of GPS files and paper maps marked with different-colored highlighters—to a GIS specialist, who would digitize the new information and print out maps for READs to mark up by hand the following day.
During the Ferguson Fire, however, the lead READs saw an opportunity to expand the use of mobile GIS. They brought on GIS specialists to support the READ team directly. For the first time, all READs had access to a frequently updated map in Collector, rather than a standard poster-sized paper map. This gave them attribute information and better feature clarity than they had before. They could toggle various layers on and off to focus on specific aspects or areas of the wildfire. And because everyone was using a common data platform, READs could more easily communicate with incident managers, agency land managers, and public information officers about the status of sensitive habitats, historic sites, and other important resources that were scattered across a large and complex landscape.
It was a big shift—one that had distinct implications for each of us in our different yet intertwined roles as GIS specialist and READ. Here, we offer a closer look at what this digital transformation meant for repairing sensitive areas after the Ferguson Fire.
Supporting GIS in the Field
Elizabeth Hale, GIS Coordinator, Yosemite National Park
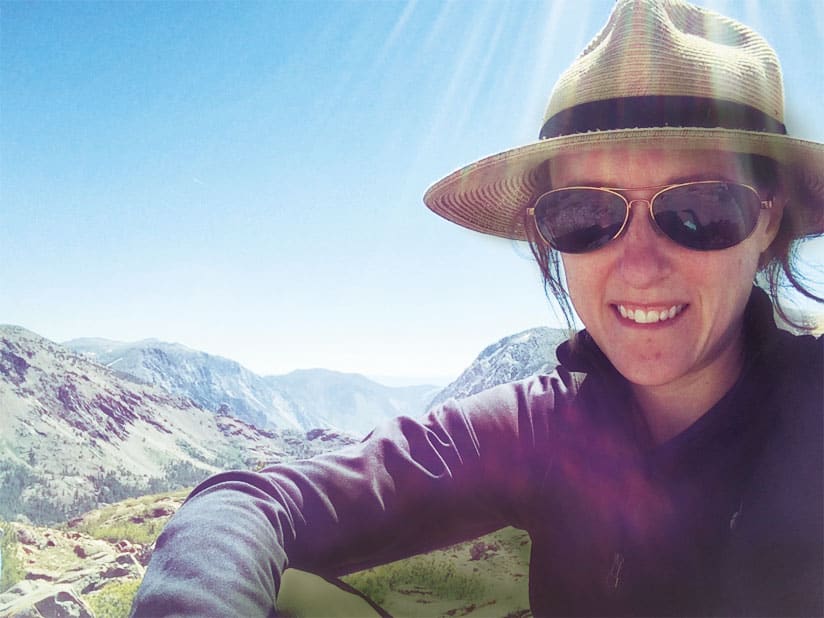
Using Collector and ArcGIS Online during the Ferguson Fire moved incident GIS staff, like myself, away from “let me map that for you” to “see for yourself.” With READs able to edit data themselves and sync their updates directly from Collector to the National Incident Feature Service (NIFS), I spent little time digitizing data and downloading GPS files.
That’s not to say there weren’t growing pains. Since I no longer facilitated data transactions, data quality assurance had to be managed on new fronts. I had to establish deadlines for syncing edits and make sure READs were not editing the same feature offline. Issues arose with duplicate lines in NIFS, so I had to track down the lines that had accurate attributes. Also, I ended up reviewing the edits and new records for each day’s field efforts after they were incorporated into NIFS rather than before.
Overall, though, I really saw this transition enhance communication. Once a wildfire is contained and crews transition to suppression repair, incident GIS staff know that the incident planning team will start asking for daily updates on repairs: What is the status of all the dozer and hand lines? What about the roads that served as fire lines? How many miles have been repaired, and how many still need to be taken care of? We usually write the answers to these questions on a whiteboard in the GIS tent or trailer so the situation leader, plans chief, or lead READ can see them when they pop in.
On the Ferguson Fire, I did something different. I built a dashboard with Operations Dashboard for ArcGIS to report the status of suppression repair. I figured it would save me the time and effort it took to recalculate the numbers each morning from a series of queries and selections in the attribute table. The dashboard automatically summarized how many miles had been completed, were in progress, or still needed repair. I broke this up based on fire line type as well. This took reporting to the next level because not only did the dashboard display concrete numbers, but it also let incident managers filter the map layers by repair status to see, on a web map, where specialized equipment or repairs were still needed.
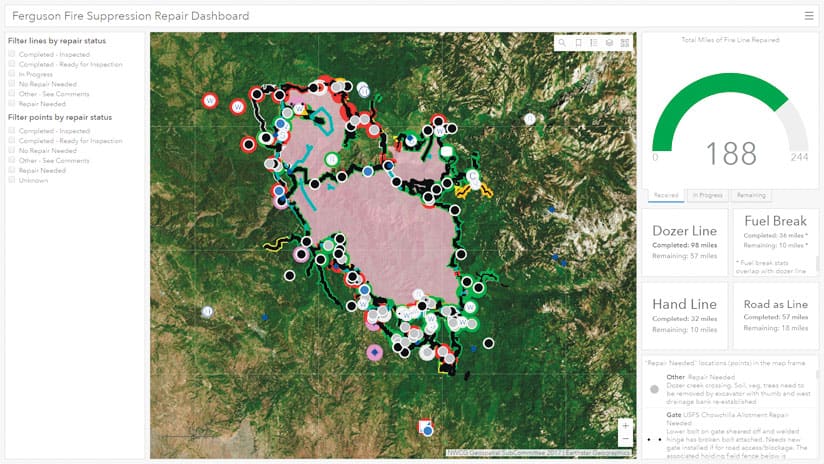
I ended up demonstrating the product to the lead READs and agency administrators from the US Forest Service and the National Park Service. This initiated a productive dialog about how much more GIS could do to support incident response and recovery.
Using GIS in the Field
Michelle Barry, Conservation Planner, US Fish and Wildlife Service, Pacific Southwest Region
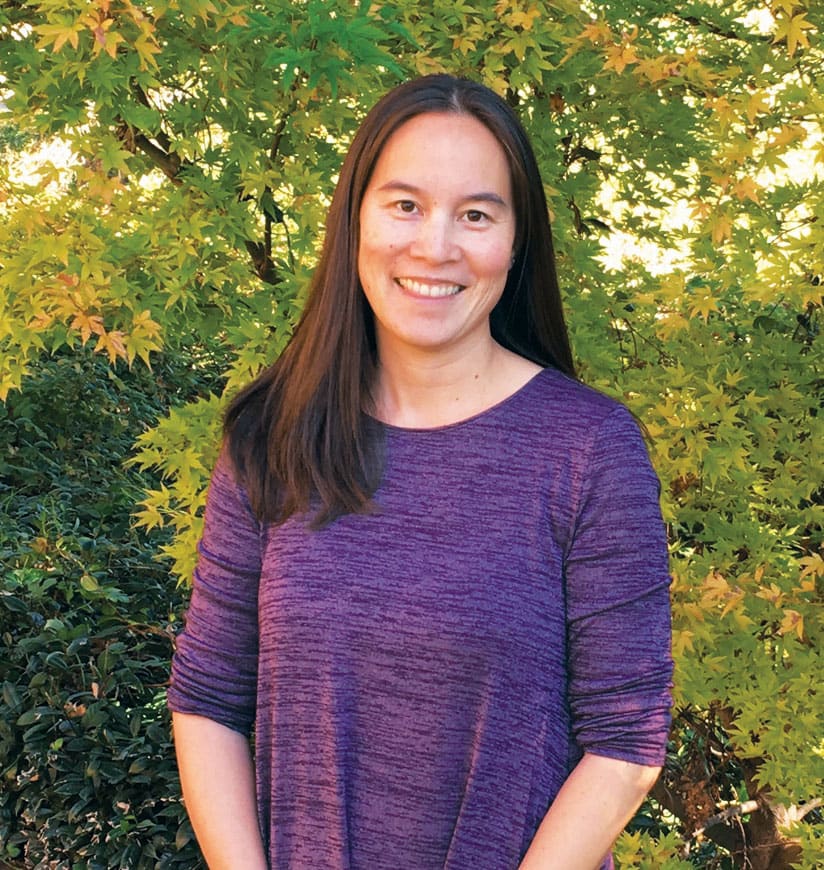
As a planner for national wildlife refuges with the US Fish and Wildlife Service, I am occasionally asked to work as a READ for fires or other emergency responses. During the Ferguson Fire, I provided coordination and leadership for more than 30 other READs. It was a challenging assignment involving a large fire area, a sizable READ team, and several agency land managers.
It was clear to me from the beginning that GIS was being used heavily for resource advising during the Ferguson Fire. Upon arrival at the incident command post, my first instructions were to visit the GIS trailer, create a user name in the National Interagency Fire Center’s (NIFC) ArcGIS Online organizational account, and download Collector on my smartphone. Soon, I learned how to access geospatial information for the entire expanse of the fire, make notes directly in Collector while out in the field, and later sync any information I gathered so the GIS specialist could incorporate it into the incident map.
As a first-time user, I found Collector to be nimble and user-friendly. It was also very useful for coordinating the READ team. Because the fire spanned such a large geographic area, some READs were stationed hours away from the incident command post. Knowing that they would all sync their updates with ArcGIS Online each night ensured that the NIFS was current across the entire fire area. Thus, when I was asked by agency land managers or others for information on specific sites, I had almost all the data from the READ team at my fingertips. I could tell them how much repair work was still needed in certain areas or how much time it would take for heavy equipment to complete repair work in particular locations.
At some point while working the fire, I remembered being introduced to GIS by my late dad, Mike da Luz. As a wildland fire hotshot, a district ranger, and a regional branch chief of fire and aviation (among other roles at the US Forest Service and, later, Esri), he understood early on how geospatial analysis could better inform land management decisions. More than 25 years ago, he showed me a simple GIS map of forest conditions on the (former) US Forest Service Alsea Ranger District, which encompasses parts of the Siuslaw National Forest in Oregon. As he printed the map, we watched together while four primary-color markers rendered rudimentary symbology on plotter-sized paper. I recall him saying, “GIS will play an important role in natural resource management in the future.” It was obvious then that GIS was a valuable tool, but at the time it was also cumbersome and time-consuming.
Now, I can access far more geospatial data on my phone than ever could have been plotted on that piece of paper. My dad had been right: GIS is playing an increasingly integral role in informing resource management. He would have been delighted to see the advancement of GIS in complex fire management scenarios, as exemplified by the Ferguson Fire.
GIS and the Future of Incident Management
GIS has advanced exponentially over the last 25 years. As we continue to look forward, it will be exciting to see what geospatial analysis can bring to future resource management in general—and to fire incident management specifically.
For more information about how GIS was used for fire incident and resource management during the Ferguson Fire, contact Michelle Barry at Michelle_Barry@fws.gov or 530-889-6525 or Elizabeth Hale at Elizabeth_Hale@nps.gov or 209-379-1307.
