The Catastrophe Services division of the Property & Liability Resource Bureau (PLRB), a trade association for the insurance industry located in Downers Grove, Illinois, provides its members, which are insurance companies, with access to educational and technical support resources that help improve productivity in the claims adjustment process.
PLRB staff answer critical questions about where policyholders are located, how loss might aggregate, and how exposure is quantified for severe weather events, such as tornadoes, high winds, and hail. Other natural and man-made sources of potential loss, including hazmat releases, terrorism, floods, and wildfires, also are discovered and analyzed.
“Supporting our members’ needs is central to PLRB’s mission,” says Hugh Strawn, vice president of Catastrophe Services, PLRB.

One of the most frequent and high-priority member requests has been for a comprehensive tool to visualize, analyze, and quantify portfolio risk and compare that risk to current, past, and future peril data. Members also identified how the latest imagery from impacted regions would allow them to instantly compare situations before and after an event. Finally, members wanted an intuitive way to collaborate and share information with key stakeholders in their organizations that enabled them to quickly and easily tell the stories they needed to convey.
While PLRB was looking for both a partner and a base solution that could be configured and customized to its business process and practices, Esri Gold Tier Partner GeoDecisions (Camp Hill, Pennsylvania) was recommended due to its record of building applications based on ArcGIS for Server. GeoDecisions created a solution for PLRB called PLRB Map on the ArcGIS platform. From the beginning, PLRB Map was designed to be accessible via traditional desktop web browsers and mobile devices. This ensures that members get the information they need anywhere, whether in the office or in the field. It also simplified the needs for sharing and accessing information by requiring members to log in on approved devices that are connected to PLRB’s secure servers.
This solution houses data securely and internally at the association’s headquarters while still providing member access to external data sources and important real-time information. It is easily customized and can expand to ensure future needs and scalability are fulfilled.
Gathering Data, Building Insight
Says Strawn, “PLRB needs constant performance and data access, independent of the number of members using the application, even during the biggest event or when teams of adjusters are deployed in the field.”
To support its visualization and analysis needs, the project team identified and gained access to a wealth of rich and varied event- and insurance-focused data. PLRB Map provides access to current and historic weather and cartographic data, sourced from both public and commercial domains.
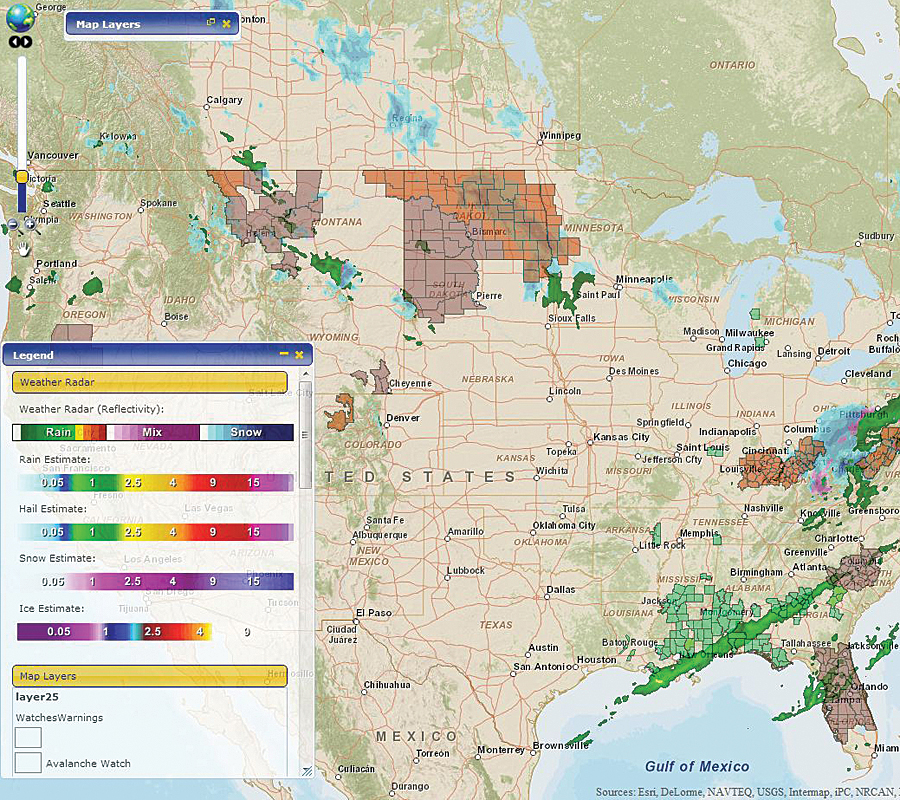
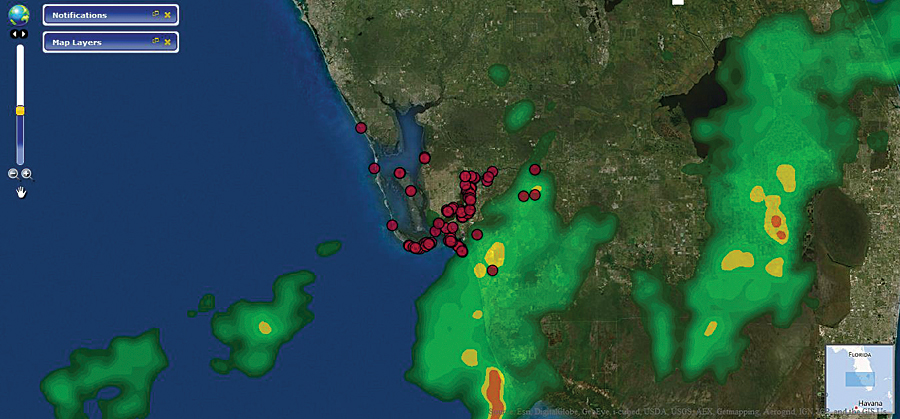
Meteorological events play a large part in catastrophe modeling, so PLRB uses its solution to deliver real-time radar reflectivity, including detailed patterns of precipitation falling at the present time, as well as future precipitation estimates for national-level forecasts of rain, hail, snow, and ice based on different time periods. The solution also tracks curated wind conditions, a highly specialized service that includes current wind conditions. Should a severe event occur, such as a tornado or microcell, PLRB members can use PLRB Map to retrieve a geographic representation of the intense rotational and wind conditions.

Analysis in North America wouldn’t be complete without detailed information on tropical weather—which drives many incidents in the Gulf and East Coast—such as authoritative real-time and historic data from the National Hurricane Center, including areas that are under tropical storm watch or warning, hurricane track points, lines, and the “cone of uncertainty,” as well as storm surge projections.
“These can all be used to predict future extent and location, especially when used together with wind speeds and hurricane category overlaid with labels and the 72- and 120-hour forecast periods,” says Strawn.
Members also can search for and analyze historical perils, such as tornadoes, floods, and severe storms, some of which are contained in an archive stretching back to 1950. The historic overlay and insight allow users to gain perspective on long-term risks and trends. Any of these layers can be displayed against multiple basemaps, including streets, satellite imagery, topographic details, and landscape and hybrid maps. Premium DigitalGlobe satellite imagery is provided to members for postevent analysis. Available within 24 hours after a catastrophe event, users can log in and get an aerial overview of an affected area, which can be compared against the portfolio or any of the other PLRB datasets.
Answers—Anywhere, Anytime
In early 2013, PLRB realized its goal of adapting GIS to provide member services on the go via smartphones and tablets. An adaptive, mobile-specific version of PLRB Maps delivers simple, responsive access to the application for field operations, particularly in claims adjustment situations. Adjusters inspecting claim reports at specific locations can use their in-device GPS or address search to quickly access, summarize, and visualize any of the map data to help verify claims. For example, an adjuster dealing with hail damage can generate a list of all hail or any other peril reported nearby, which they can then overlay on the map or satellite imagery. Sharing the information and map views is built into the application, so colleagues receive valuable reports via e-mail without the need to use other plug-ins or installations.
Perhaps the most significant benefit provided by PLRB Map is the ability for member organizations to leverage analysis of their own policyholder data and combine this with visualization of other member portfolios relative to catastrophe data or events. By providing secure, temporary access to commonly held data, PLRB members can visualize and analyze risk specific to each member’s portfolio. Catastrophe managers are able to make strategic decisions about the risk and impact on their portfolio days in advance of upcoming events by using forecasts and other data services.
Other advantages include the ability to identify areas with high rotational wind probability, often a precursor to tornado events, within minutes of an occurrence.
“Typically, there is a 24- to 48-hour period between the event and ground-verified damage assessment,” says Strawn. “Members can now quickly assess potential paths and impact against different portfolios and make plans to respond to potential and actual damage.”
Assessing lightning strike probability for any location and date also is an advantage. PLRB Map users can generate indicative statistics on the probability that a cloud-to-ground lightning strike occurred.
“The ability to do this enables the claims departments to more easily assess the veracity of any claim,” says Strawn.
Investigating a particular claim or pattern of claims based on historical weather events is another advantage. By using a date range, the type of hazard(s), and a specific location, the solution will map or list the events so that further investigation, exploration, or analysis can be performed.
It provides tools that leverage the full depth and richness of policyholder address data. Rather than work on a single address or event region, the system lets users map, identify, and understand the patterns and probabilities for each and every policy in the area. These probabilities can even be appended to the data for use outside the app in any popular spreadsheet format, which can later be used in other tasks.
PLRB ensures the privacy and security of its members’ policyholder records and has designed the application accordingly.
For more information, contact Hugh Strawn, vice president, Catastrophe Services, Property & Liability Resource Bureau (tel.: 630-724-2230), and Brian Smith, director, Commercial Solutions, GeoDecisions.
Related Podcast
Location Analytics in the Insurance Sector
Brian Smith, director of commercial solutions at GeoDecisions, discusses the various applications of location analytics in the insurance industry. Listen to the podcast. [06:00 | 5 MB]

