There are 2,892 miles separating the two farthest points in the continental United States, and exploring each of those miles presents an opportunity to reexamine history and issues concerning equity, justice, and race. This is according to an educational endeavor supported by the National Geographic Society—2892 Miles to Go. As the creators of the project’s storytelling platform assert, “It is long past time to walk these miles together.”
The program cultivates intergenerational collaboration to illuminate unacknowledged stories that center on the environmental, social, and cultural issues impacting local communities across the country. Recognized with the Special Achievement in GIS (SAG) Award at the 2024 Esri User Conference, 2892 Miles to Go leverages geospatial storytelling and analysis tools such as Esri’s ArcGIS StoryMaps and National Geographic’s MapMaker—an interactive mapping tool for students—to amplify youth voices.
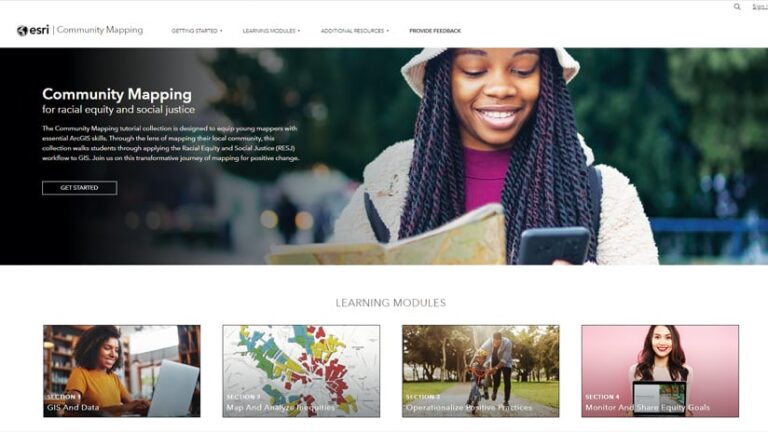
In 2024, 2892 Miles to Go partnered with Esri’s education and tutorials team to integrate the Community Mapping for Racial Equity and Social Justice (RESJ) tutorial collection into the organization’s programs. Not only has this collaboration taught young people how to use a variety of GIS tools, but it has also helped them advance the work they do to improve their communities.
Hear from four students who participated in the 2892 Miles to Go program—all of whom completed the tutorials and then employed GIS to engage with their neighbors, explore issues within their communities, and propose solutions to underemphasized problems. Explore some of their ArcGIS StoryMaps stories.
Sara Marquez
High School Senior, Denver, Colorado
Young leaders often find themselves overshadowed by adults. But 2892 Miles to Go gives young people a platform to voice their concerns effectively. By integrating GIS into our learning, we can break through systemic and societal barriers to drive impactful change in our communities.
In partnership with 2892 Miles to Go, youth from the Young African American and Latinx Leaders (YAALL) program in Denver, Colorado, investigated inconsistencies in restorative justice programs at Denver public schools. Restorative justice focuses on repairing the harm a crime causes beyond punishing the offender.
YAALL members, like me, first did the Community Mapping for RESJ tutorials, which cover the basics of GIS and data as well as how to map and analyze inequities, use GIS to engage with the community and develop solutions, and monitor and share equity goals. The group then used ArcGIS Survey123 to create surveys to give to the community; and ArcGIS StoryMaps to illustrate correlations among school locations, how many restorative practice coordinators there are per school, and each area’s socioeconomic status. The results showed that there are fewer restorative practice coordinators at schools in historically marginalized, lower-income areas.
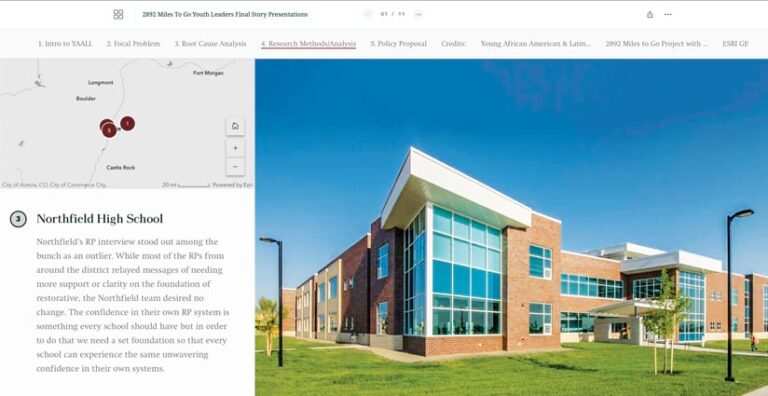
The Community Mapping GIS tutorials gave YAALL members the tools and confidence they needed to recommend a district-wide policy change to establish baseline requirements for restorative justice practices. Project participants also learned that effective leadership requires understanding historical context.
By harnessing the power of GIS, YAALL members gained a deeper connection to the past, identified systemic oppression patterns, and acquired technical skills that they can use to forge a bright future. Empowered with these tools and knowledge, young people can advocate for change while also becoming the drivers of that change.
Abraham Muñoz
High School Senior, Denver, Colorado
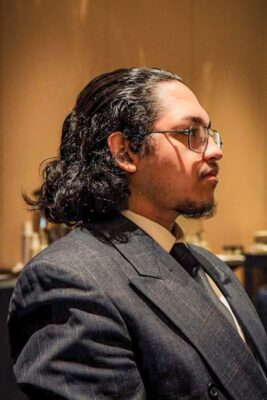
Programs like 2892 Miles to Go help young people find their voices and recognize that they are not alone in wanting—and working—to make their communities better. I wouldn’t have been able to achieve a deeper understanding of my community of Denver without it.
After going through the Community Mapping for RESJ tutorials, members of the Manual High School Student Voice and Leadership team, which I am a part of, employed GIS to create charts and maps that used critical data relevant to investigating curriculum disparities within our school and across the district. Using Survey123, we gathered input from educators and students on curricular content and youth mental health. We then took data from ArcGIS Living Atlas of the World—including data on demographics and economic inequities—and created a community asset map that showed not only where there are disparities in curriculum but also how educators and students aspire to change the curriculum and incorporate historical insight into it. This gave us the ability to address issues in our community that we otherwise would not have been able to see.
As the Manual High School Student Voice and Leadership team embarks on a second year in the 2892 Miles to Go program, we plan to apply GIS to explore and address other youth-identified issues in the community, such as how to achieve climate sustainability, deal with homelessness and hunger, handle discrimination, and improve teacher-student connections in schools.
Indigo Smith
High School Senior, Denver, Colorado
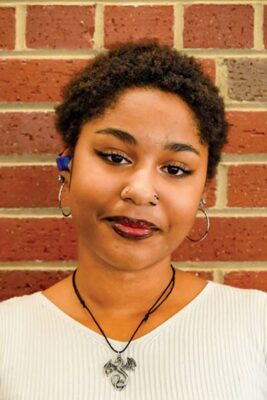
Too often, young people are underestimated and underrepresented, and their voices go unheard. But young leaders crave respect—and 2892 Miles to Go gives youth a platform to use to garner that appreciation.
My experience in the 2892 Miles to Go program enabled me to advocate for my school, Manual High School, in Denver. Using a host of ArcGIS Online tools, my classmates and I explored why education is so important for communities of color.
Through the Community Mapping for RESJ tutorials, we learned how to display demographics and income data for specific neighborhoods in our community. We explored issues such as redlining and the kinds of resources each neighborhood has access to—or doesn’t. The maps we made illustrated how people located in the same area can live in different realities. While learning from the tutorials, I was taken aback by carbon emissions maps that revealed how people of color are more likely to live in areas with heavy air pollution, especially if they have lower incomes. These examples helped me visualize racial inequities and the parallels with my community.
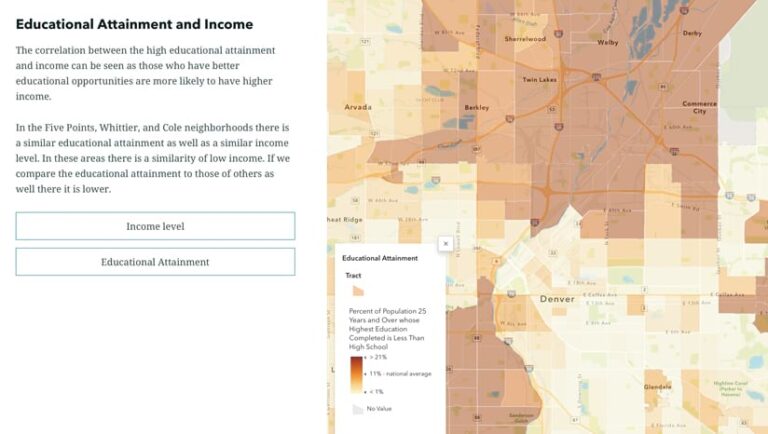
The tutorials taught us how to create surveys using Survey123. After people in our community filled out our surveys, we widened the scope of our project to explore issues that we weren’t aware of, including a lack of historical context in the school curriculum and a dearth of representation of historically marginalized and low-income communities in that curriculum. We then worked with leaders to address these issues by creating a new curriculum, leading professional development workshops for educators on how to incorporate this curriculum into their classrooms, and presenting our research at the American Educational Research Association’s annual meeting. Our team used ArcGIS StoryMaps to present the results of our project. The story also emphasizes our determination to ensure the success and sustainability of our community.
As a teenager who is experiencing a taste of adult life for the first time, I often lose hope, momentum, and faith in myself. Going through this program reminded me how important it is to continue to be my best self so I can make my community better.
Jilhary Cuellar
High School Junior, Arvin, California
My classmates and I collaborated with 2892 Miles to Go to explore Kern County, California’s rich history and existing issues. In making my way through the Community Mapping for RESJ tutorials, I learned how to use ArcGIS to connect with the people I want to learn from, work with, and support.
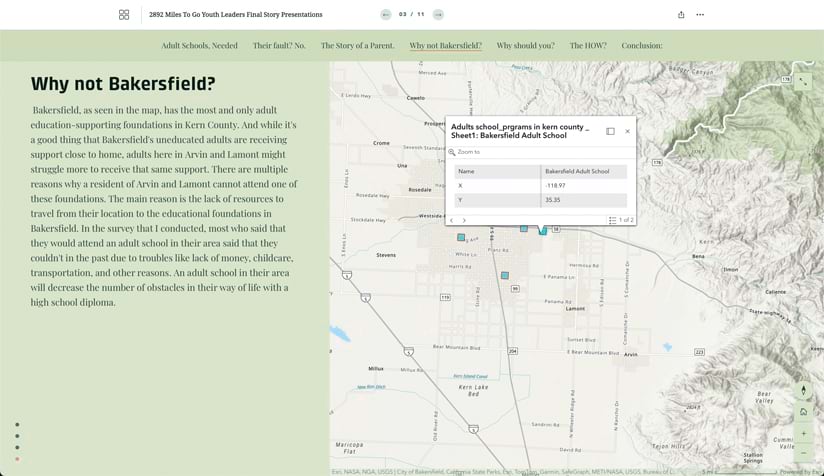
The tutorials taught me how to use a variety of data to create detailed maps, apply Survey123 to ask people questions, and employ ArcGIS StoryMaps to develop an interactive story that explores my community. The issue I focused on was education shortfall among adults in Kern County.
Survey123 was an especially valuable tool to use to connect with people. It helped me ask members of my community questions and record their answers. And the summarized views in Survey123 made it easy to understand and draw conclusions from people’s responses.
I also used layers from ArcGIS Living Atlas to explore why most of the adults in my community lack a high school diploma and have not pursued higher education. I explored layers that showed the percentage of children whose parents are immigrants, lack housing, and work in agriculture.
The place-based learning I experienced by using GIS and ArcGIS Living Atlas gave me a clearer illustration of both the historical and present-day issues that affect the people around me. This perspective is important for youth to learn because they are the future leaders of their communities.
