Geography Can Serve as a Starting Point for Building Strong, Lasting Relationships with Communities
Have you ever walked through your neighborhood and seen a geyser of water shooting up from a broken sprinkler head, or a fallen tree branch lying in the middle of the street, or graffiti scrawled across a bus stop shelter, and wondered how you could notify the right people to come and take care of it? It’s a common situation people find themselves in, not only in their neighborhoods but also in almost any type of community they belong to.
Governments, companies, nonprofit organizations, and even loosely connected social groups such as bird watchers and people who like farmers’ markets face similar issues because they’re not set up to gather people’s observations and manage that information in a meaningful way. They lack the tools to facilitate community engagement.
Geography can serve as a starting point for building a community engagement strategy. And GIS technology can provide the tools to accomplish it. Maps and spatial analytics form a universal translator that allows individuals living and working in communities to build strong, long-lasting relationships with other people simply by sharing geographic information.
Here are three ways to get started with community engagement using ArcGIS.
1. Empower your community with crowdsourcing apps.
Crowdsourcing is the process of collecting volunteered information from people. If you give them the right tools, they can become your eyes and ears on the ground. But if social media has taught us anything, it’s that when you ask people to volunteer their observations, you may end up with more than you can handle. To avoid information overload, focus on a specific problem or a manageable set of choices.
Surveys are one form of crowdsourcing. Conducted person-to-person or via a website, they can be used to create inventories, gather information about people’s experiences, or take stock of what a community is thinking about certain issues. When combined with geography, surveys can demonstrate how important a place or the surrounding environment is to the matters in question.
ArcGIS Online subscribers can create and deploy location-based surveys using the GeoForm template, which generates responsive, web-based forms. For example, an emergency management organization could develop an inventory of medical personnel for disaster preparedness activities by asking doctors and nurses to visit its website and fill out an identification form.

GeoForm makes conducting surveys simple and straightforward and gives them a sense of urgency that a community can understand. Its source code can be downloaded on GitHub.
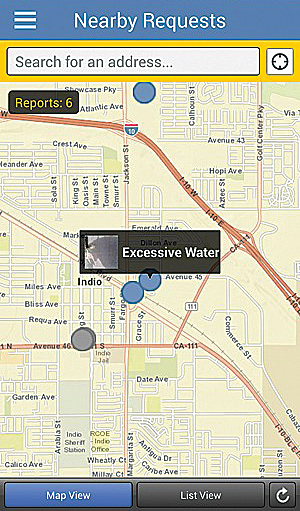
The Esri Crowdsource Reporter app template also makes it easy to integrate geography with important issues. The template, available from ArcGIS Online (with the source code on GitHub as well), allows developers to configure responsive apps that work on smartphones, tablets, and desktop browsers to maximize community engagement.
The City of Los Angeles, for example, began a concerted water conservation effort called EveryDrop to help tackle California’s current serious, decadelong drought. The project’s mission is to provide applications to the public and government agencies so they can help curb water waste and promote water conservation. As part of the EveryDrop platform, the city offers a free crowdsourcing app for Apple and Android phones that allows citizens to report the location of water waste. The app also teaches users how to better conserve water.
Empowering people to send in their observations is one thing; doing something with the data is another. A critical process for maintaining a crowdsourcing channel is to aggregate the crowdsourced data, analyze it, and then take action.
Crowdsource Manager, a companion application to Crowdsource Reporter, helps organizations do just that. It presents data in both map and table formats and includes tools for finding patterns, reviewing details, updating statuses, and assigning responsibilities. This template is also available for free with an ArcGIS Online subscription.
2. Tell stories to your community.
Telling people a story that’s relevant to their location is powerful—especially if it’s related to an issue they care about. Storytelling is also a great way to communicate with stakeholders inside an organization, including managers and executives.
Giving a narrative form to geographic information impresses it with realistic character that just doesn’t come across in charts or graphs. Story maps, which combine interactive maps with multimedia content, provide an engaging way to explore data and navigate information nuances.

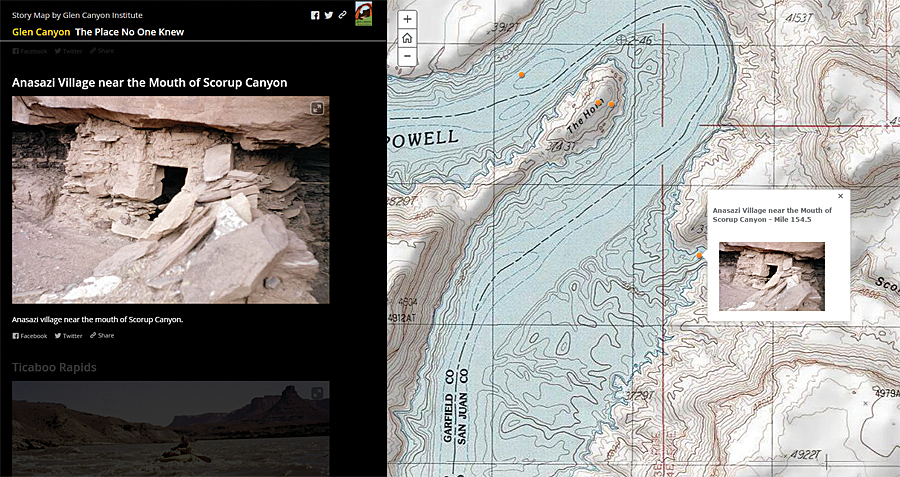
The Glen Canyon Institute, a nonprofit that seeks to restore and preserve southern Utah’s Glen Canyon, which was flooded in the 1960s when part of the Colorado River was dammed, has a loyal community of members and people who want to get involved in its conservation projects. One of the ways the institute communicates the importance of its mission is by providing a story map on its website that takes viewers on a virtual tour of the Colorado River, using more than 100 photos of key points of interest.
ArcGIS Online subscribers can create and share their stories using Esri Story Map applications, including Esri Story Map Journal, the one that the Glen Canyon Institute used. While creating a story map may seem like a daunting task, it is actually just a matter of organizing and presenting the information; the Story Map template takes care of the rest.
3. Use dashboards to help drive your community engagement strategy.
Dashboard applications, which consolidate complicated and often dynamic information into one simple view, are escalating in popularity. That’s because everyone wants to know the status of a project or get minute-by-minute updates on events in progress such as elections or emergency management operations.
Dashboards help people absorb information with just one glance, much like looking at the dashboard of a car. These applications can be specific to project activities or organization assets and can outline the progress of a program as a whole. This makes dashboards especially important for decision makers and other people who need to stay on top of unfolding situations. They need to know what’s going on and where things are happening—in one look.
Geography works well with dashboards. Maps again become the universal translator that helps people orient themselves to the information at hand. However, unlike crowdsourcing, which can evolve into a long-term dialog between communities, and in contrast to story maps, which can be used to reinforce the scope and commitment of one community to another, dashboards get more personal and go behind the scenes. They can help organizations monitor and evaluate their community engagement strategies.

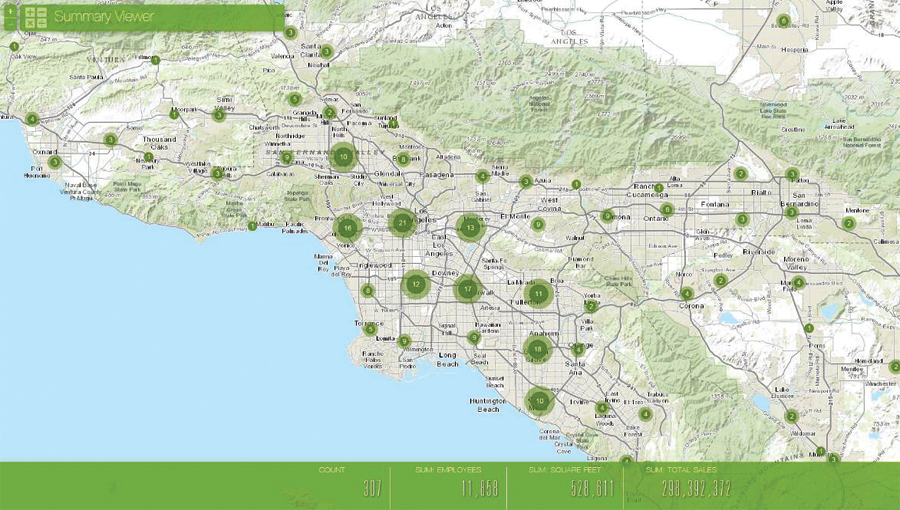
The Summary Viewer solution template, available with an ArcGIS Online subscription, can turn a map into a dashboard to report metrics. It summarizes the numeric attributes of features in a specified map layer and displays the ones that appear on the visible area of the map. The summaries can be configured to show the sum, average, minimum, and maximum of specified field values.
So, for example, the owner of a chain of retail stores could see all his stores in a given geographic area, plus the total number of employees, the square footage, and the sales amounts for those stores, all on one dashboard.
Everything Rolled into One Community Engagement Project
To give a more encompassing example, let’s say a city is looking to streamline its processes for fixing potholes. It could develop a crowdsourcing app that encourages the community to report potholes on city streets. An operations manager could use the Crowdsource Manager app to organize and validate reports and then assign work appropriately. The city could then put up a public-facing story map that displays the crowdsourced information and shows the potholes that have been fixed to assure the community that their reports are making a difference. Meanwhile, project stakeholders could use an internal dashboard to stay abreast of how the project is going and what is being accomplished.
Building Apps, Building Relationships
Community engagement initiatives hinge on active listening, participation, and trust. Geography and mapping technology can play a key role in opening up and sustaining the communication channels necessary to successfully support communities both inside and outside an organization. Getting started with a few simple GIS applications can help organizations build strong, long-lasting relationships with their communities.

